US Debt Sustainability: An Uncertain Fiscal Future
By the time US voters head to the polls in November, US gross federal debt is expected to have surpassed $35 trillion. This record number is larger than the size of the country’s economy and more than double the level of debt in 2014. There are no obvious signs of the troubling trajectory changing course. The Congressional Budget Office (CBO) predicts gross federal debt will reach $54 trillion by 2034, or 116% of US GDP—an amount greater than at any point in the nation’s history.1 This is a conservative estimate as it assumes that none of the tax provisions in the Tax Cuts and Jobs Act will be extended, which is an unlikely outcome. If all tax provisions are extended, the CBO projects debt to grow by over 130% of GDP by 2034. The federal budget deficit (i.e., the difference between government revenue and spending) is also expected to widen, from $1.9 trillion this fiscal year (5.6% of GDP) to $2.6 trillion (6.1% of GDP) a decade from now—above the 3.7% of GDP that deficits have averaged over the past 50 years.2
The reality could turn out to be even more severe. The CBO’s baseline projections assume that 1) no US recession occurs in the next ten years, 2) inflation falls back to normal levels and stays there, and 3) debt financing costs remain low. Either way, an already substantial fiscal burden is set to grow further, with higher-for-longer interest rates posing a challenge to serviceability. We maintain our view that US debt dynamics are not a near- to medium-term threat for the US economy. That said, we believe it is prudent to reexamine the headwinds contributing to ballooning US sovereign debt levels, the unique capacity of the US economy to withstand such conditions, and potential long-term investment implications.
How Much Debt is Too Much?
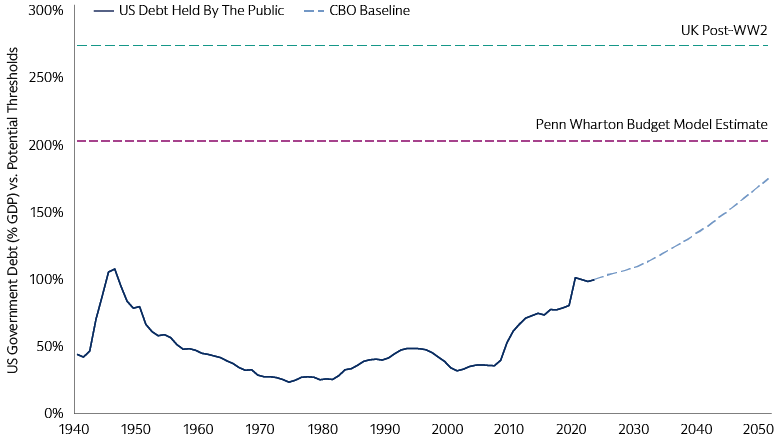
Mounting US debt levels raise the question of when a tipping point may occur. Fitch’s downgrade of US sovereign debt in 2023, from AAA to AA+, was perhaps an early warning sign. The CBO’s assessment is that no threshold can be identified at which the debt-to-GDP ratio would become so high that it makes a crisis likely or imminent, nor is there a fixed point at which interest costs would become so high in relation to GDP that they were unsustainable.3 The Penn Wharton Budget Model and International Monetary Fund (IMF) estimate that US debt held by the public as a percentage of GDP would have to reach 175-200%4 and 160-183%, respectively, to put the US at risk of defaulting. The US debt burden currently stands comfortably below each of these thresholds and is not projected to breach the lowest in the next 25 years.
The trajectory of debt-to-GDP is highly sensitive to the assumed gap between the interest rate and GDP growth. Analysis by Goldman Sachs Global Investment Research suggests that if the rate of interest exceeds the growth rate of GDP alongside a growing debt stock, the current fiscal trajectory could eventually push the debt-to-GDP ratio to a point where stabilizing it would require a large fiscal surplus, though that level is probably quite a ways off.5 A large and consistent surplus is rare, however, and it has been over two decades since the US has had even a modest surplus. And while conditions for fiscal consolidation are currently in place in the US—economic growth is resilient and private sector balance sheets are broadly healthy—there is little political momentum for deficit reduction.

Source: International Monetary Fund, Penn Wharton Budget Model, Bank of England, Congressional Budget Office, Goldman Sachs Investment Strategy Group, and Goldman Sachs Asset Management. As of May 15, 2024. Chart indicates the levels at which the level of US debt held by the public as a percentage of GDP might become unsustainable. “GDP” refers to Gross Domestic Product. ”CBO” refers to Congressional Budget Office.
How Unique is the US?
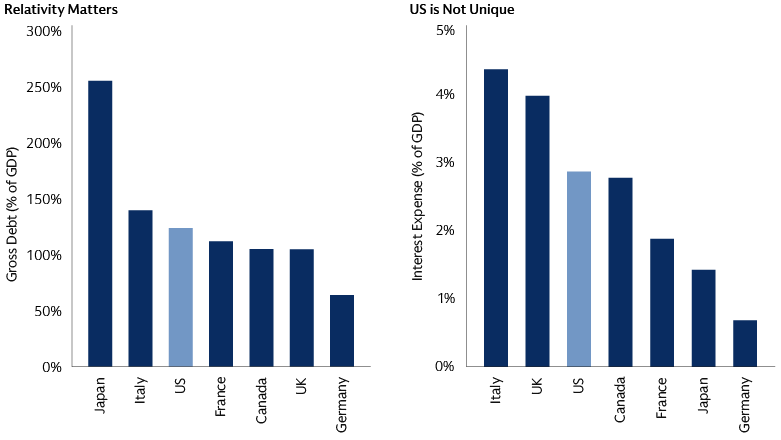
The US is not alone in facing fiscal challenges. In the euro area, the current gross debt as a percentage of GDP stands at approximately 89% (compared to the US level of 97% at the end of 2023). This is lower than a decade ago, despite the COVID-related expenditures of recent years. The IMF estimates the euro area’s structural deficit to be down to 2.7% (versus the US at 6.5%) by the end of this year.6 At the country level, debt trajectories are likely to diverge across member states over the coming quarters and years ahead. Primary balances in Germany and Spain may continue to improve at a fast enough pace for debt ratios to fall. Political uncertainty could push the French fiscal outlook back into a more challenging equilibrium, while Italy’s near-term growth challenges could result in further fiscal slippages.
Outside of the euro area, the UK’s debt level is below the G7 median. Despite concerns about the UK’s longer-term fiscal position, there are also reasons for optimism and the UK has a track record of responding to rising debt with fiscal consolidation.7 However, 2022’s UK mini-budget and subsequent liability-driven investment (LDI) crisis provided a vivid illustration that even deep and liquid capital markets can rapidly dislocate if there is a shock to sentiment. Japan is the G7 outlier. For more than two decades, Japan’s national debt has floated above 100% of its GDP.8 The gross figure currently stands at approximately 255%, the highest of any developed nation, driven higher in recent years due to fiscal expenditure to address the pandemic.9 Japan’s refinancing costs are less burdensome, however, given lower levels of interest rates relative to the rest of the G7. Japan also has a large pool of domestic investors and corporations investing in Japanese government bonds.
Relative to G7 peers, we believe the US economy has unique strengths allowing for significant fiscal flexibility. The dollar’s unique role as the global reserve currency means the US can draw on global savings. Deep capital markets in the US solidify the dollar’s reputation and longevity, allowing foreign central banks to reliably invest their reserves at scale in US government debt, all of which enhances the safe-haven attributes of the US dollar—the world’s reserve currency. One question for investors to consider is perhaps not whether investors will buy US debt, but at what price they are willing to buy at. We see no signs of a buyers’ strike. The dollar isn’t on a downtrend. If global investors were reducing holdings of US debt, this would be reflected in consistent USD weakness, which hasn’t been seen to date.

Source: International Monetary Fund, Goldman Sachs Investment Strategy Group, and Goldman Sachs Asset Management. As of May 15, 2024. Left chart shows data as of 2024. Right chart shows data as of 2022. “GDP” refers to Gross Domestic Product. “G7" refers to the Group of Seven.
Feels Like the First Time?
The US has had debt since its inception as a sovereign nation, including periods of very high debt levels. Large debt reductions have been achieved in different ways—some almost entirely with sustained fiscal surpluses, others with combinations of low interest rates relative to GDP growth, high inflation, and financial repression.10 The late 1990s US debt reduction occurred mainly through primary surpluses. A combination of factors, including high inflation and financial repression, contributed to the post-World War 2 debt reduction. The US ran a primary surplus nearly every year from 1946-1974, and ultimately lowered debt-to-GDP by over 80%.
The real US economic growth rate, or real GDP growth rate, averaged 4% in the 1950s and 1960s and this proved key in controlling debt in the post-World War 2 era. Today, despite a resilient economy, we do not believe the US can match those prior growth levels in the years ahead. Growth levels have cooled off to below 2% in the past decade and the CBO forecasts real US GDP growth to drop to 1.7% annualized over the next thirty years.11 Between cutting spending and growing out of the debt, strong growth is preferable, but neither solution seems likely.
Tailwinds and Headwinds: From AI to Aging Demographics
The fiscal future of the US and other nations depend on multiple factors—from potential AI productivity boosts, and aging demographics, to tax changes, defense spending and challenges to debt serviceability from higher-for-longer interest rates. We believe boosting productivity growth through AI represents an opportunity for nations to confront high debts and deficits. Generative AI (GenAI) could be the tool that provides macro-level productivity gains. Analysis by Goldman Sachs Global Investment Research suggests that the potential economic upside for the US from GenAI is significant, with baseline estimates implying as much as 15% cumulative gross upside to US labor productivity and GDP following widespread adoption of the technology.
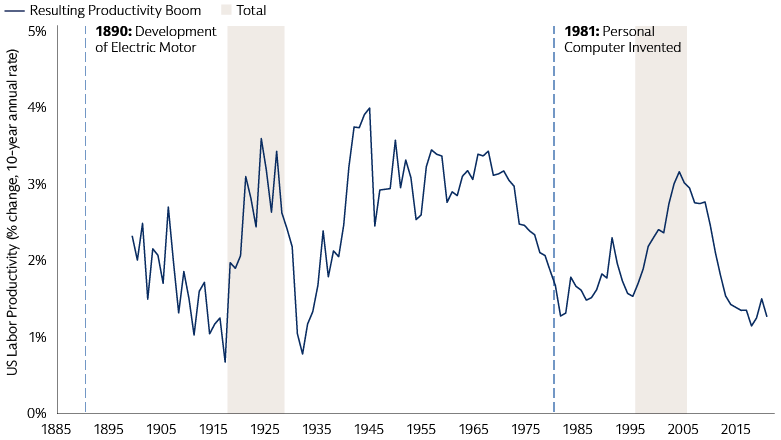
AI adoption is so far modest outside of a few industries, and adoption rates are likely to remain below levels necessary to see large aggregate productivity gains for the next few years. The widespread adoption of previous inventions, including the electric motor (1890) and the personal computer (1981), were followed by US labor productivity booms to the tune of 1.5% of labor productivity growth annually—circa 20 years for the electric motor and approximately 12 years for the PC—for a cumulative impact of ~15%.12 These labor productivity growth phases also resulted in a 7% increase in annual global GDP over a ten-year period. If GenAI has a similar impact, the US may realistically be able to outgrow its debt.

Source: Goldman Sachs Global Investment Research and Goldman Sachs Asset Management. As of June 15, 2024. Chart shows the percent change in US Labor Productivity around two historical inventions that modernized technology. This material is provided for educational purposes only and should not be construed as investment advice or an offer or solicitation to buy or sell securities. For illustrative purposes only.
Aging demographics and geopolitics present structural headwinds to achieving debt sustainability, with the G7 especially experiencing lower birth rates as opposed to emerging markets. These factors may even offset the impacts of productivity gains driven by GenAI. In the US, declining fertility rates and an aging population are not as much of a challenge as in other G7 countries, but fertility rates are at an all-time low while the last of the baby boomer generation is reaching retirement. An imbalance between incoming workers and the share of entitlement spending will likely place additional stress on the federal deficit. Increasingly complex and unstable geopolitical affairs also create upward pressure on governments to spend more to protect against supply chain and national security threats. Disciplined spending on health and defense may be important components to potentially lowering deficits and finding a path to a more debt-sustainable future.
Looking Ahead
Changes in the deficit impact economic growth and inflation, and therefore influence near-term Federal Reserve (Fed) policy. The long-term impact on interest rates is difficult to predict. Higher deficits may lead to higher growth in the bond supply, potentially impacting term premia. Auction demand for US government bonds has recently been scrutinized since bond auction sizes began increasing since August 2023, but the bid-to-cover ratio and primary dealer takedown—two metrics with which to measure supply/demand balance—are both in line with their respective long-term averages. The third metric, debt stock, also has an ambiguous impact on market rates. Ultimately, we do not think that increases in the US debt will result in structurally higher US government bond yields.
The US election could change the medium-term fiscal outlook, though potentially less than one might imagine. The expiration of former President Trump’s tax cut policy will be a major point of interest for investors and US citizens alike, as tax policies create a near-direct impact on the US deficit and disposable income. Although the platforms of the presidential candidates this year could not be more different, their impacts to the federal deficit may be similar, regardless of whoever ends up taking office.13 A Republican victory may lead to a continuation of tax cuts, therefore reducing revenue collected by the US to fund its expenses. A win for the Democrats, on the other hand, may lead to a similar extension of the tax cuts or an increase in spending that would offset the increase in tax revenues after Trump’s tax cuts expire.
Overall, the focus on fiscal sustainability has diminished in Washington in recent decades and remains low today. Compared to inflation or geopolitical events, debt sustainability is not as high-profile an issue in the public eye either. However, among investors, we are confident that the conversation on debt sustainability will not be fading any time soon. Fiscal sustainability is an important issue as it pertains to the credibility of the US dollar and the ability of the US to finance its future. The US is continuing along what will eventually be an unsustainable path, but we believe its unique strengths and the dollar’s standing as the world's reserve currency continue to provide a solid foundation for the economy, even as fiscal imbalance grows.
1. Congressional Budget Office (CBO). As of February 2024.
2. CBO. As of June 2024.
3. CBO. As of June 2023.
4. Penn Wharton Budget Model as of October 6, 2023.
5. Goldman Sachs Global Investment Research. As of May 22, 2024.
6. IMF. As of April 2024.
7. Goldman Sachs Global Investment Research. As of June 10, 2024.
8. Federal Reserve Bank of St Louis. As of November 14, 2023.
9. IMF. As of April 2024.
10. Goldman Sachs Global Investment Research. As of May 2024.
11. CBO. As of March 2024.
12. Global Investment Research. As of June 4, 2024.
13. Global Investment Research. As of April 2, 2024.
