Market Pulse March

Market Pulse March

Market Pulse March

Middle East escalation may pose a modest risk to growth – particularly for energy importers. Still, we see healthy global growth in 2026 with fading tariff drag, strength in capex, and fiscal support all contributing factors. In the US, we anticipate an uptick in H1, driven by tax cuts, ongoing business investment, and a stabilizing job market. In Europe, we expect the positive economic surprises to persist, fueled by Germany's federal spending.
US inflation continues to make progress as tariff effects fade. Combined with the impacts of easing shelter prices, subdued wage growth, and productivity effects from AI, we think core inflation may return to the low-2s by year-end. Euro area inflation is expected to stay near-target in the near-term, with normalizing wage growth as a stabilizing factor. Sustained higher energy prices would pose an upside risk.
We believe central banks would look through a supply shock if inflation expectations remain broadly anchored. If confirmed, we expect new Fed Chair Warsh to be on the dovish side of the policy debate as he views AI-driven productivity gains as disinflationary. In Japan, recent market volatility and legislative action may lead the BoJ to postpone a rate hike until July.

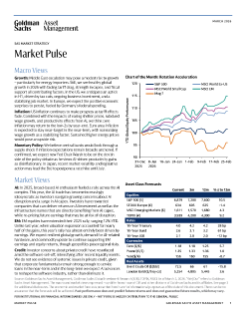
Source: Bloomberg and Goldman Sachs Asset Management. As of February 26, 2026. Chart shows the year-to-date performance indexed to 100 of the S&P 500, MSCI World Ex-US, MSCI Global Small Cap, MSCI Emerging Markets, and Bloomberg Magnificent 7 Total Return indices. Past performance does not predict future returns and does not guarantee future results, which may vary. For illustrative purposes only.
In 2025, broad-based AI enthusiasm fueled a rally across the AI complex. This year, the AI trade has become increasingly idiosyncratic as investors navigate growing concerns about AI disruption and a surge in AI capex. Investors have rewarded companies that can deliver returns on AI investment as well as the infrastructure names that are directly benefiting from AI capex, while re-pricing future earnings that may be at risk of disruption.
EM equities have extended their 2025 rally, surging 12% YTD. Unlike last year, when valuation expansion accounted for nearly half of the gains, this year's rally has almost entirely been driven by earnings. We expect resilient global growth, demand for AI-related hardware, and commodity upside to continue supporting EM earnings and equity returns, though geopolitics pose regional risks.
Investor concerns about private credit have resurfaced amid the software sell-off, intensifying after recent liquidity events. We do not see evidence of systemic issues in private credit, given that corporate fundamentals remain strong enough to service loans in the near-term and in the long-term we expect AI advances to reshape the software industry, rather than eliminate it.

Asset Class Forecasts: Price targets of major asset classes are provided by Goldman Sachs Global Investment Research. Source: “From Geopolitics to AI: market risks and the HALO effect.” As of March 2, 2026.
The Set Up for Global Small Caps
We believe small caps are set up for success in 2026 on the back of global cyclical strength, continued earnings recovery, and renewed capital market activity. Additionally, valuations continue to be attractive both on an absolute and relative basis. In the US, small caps trade at a ~25% discount to large caps (excluding unprofitable firms), near historic lows. Outside the US, international small caps, which typically trade at a premium, are now roughly on par. However, dispersion is wide, volatility high, and liquidity low, making selectivity key.

Source: Chart shows the quarter-over-quarter (QoQ) estimates for US GDP growth and Russell 2000 earnings per share (EPS) growth. GDP growth forecasts are from Goldman Sachs Global Investment Research. Earnings forecasts are from Bloomberg consensus. Bloomberg, Goldman Sachs Global Investment Research and Goldman Sachs Asset Management. As of January 31, 2026.
The macro outlook is supportive for further small-cap strength, particularly in the first half of the year. Growth acceleration has historically been a strong tailwind, driving faster earnings growth based on increased consumer spending, business investment, and normalizing interest rates. The US provides an important growth engine today – US small caps derive 80% of revenue domestically, versus 72% for large cap. US small caps also make up 60% of the global small cap universe.

Source: Chart shows the sector composition of the MSCI World Ex-US Small Cap Index and the Russell 2000. Bloomberg and Goldman Sachs Asset Management. As of January 31, 2026.
Because the small cap market is quite cyclical and value-oriented, it historically benefits from growth acceleration. However, today’s universe is interesting because it also offers exposure to secular growth themes such as AI, defense and infrastructure, and consumer spending. While technology has seen recent volatility, select companies with clear catalysts and specialized offerings may prove resilient – including cloud infrastructure, proprietary data, and cybersecurity providers.

Source: Chart shows the rolling 12-month performance differential between the top 50 stocks and bottom 50 stocks in the Russell 2000 and S&P 500. Beta refers to broad market exposure. Bloomberg and Goldman Sachs Asset Management, As of January 31, 2026.
We believe that wide dispersion in the small cap market requires a more nuanced investment approach than chasing beta. In 2025, the average performance spread between the top and bottom 50 stocks was nearly 3x greater in the Russell 2000 versus the S&P 500. Near-term exuberance can drive episodic results, but we believe sustained performance comes from identifying durable earnings and effectively navigating market risks.
“We/Our” refers to Goldman Sachs Asset Management. The economic and market forecasts presented herein are for informational purposes as of the date of this document. There is no guarantee that objectives will be met. There can be no assurance that forecasts will be achieved. Diversification does not protect an investor from market risk and does not ensure a profit. Please see additional disclosures at the end of this document. Past performance does not predict future returns and does not guarantee future results, which may vary.