Managing Equity Market Concentration: Two Ways to Improve Portfolio Efficiency




Key Takeaways
Equity index concentration is a pressing concern for investors around the world. While this issue is most acute in the US, concentration levels are also near historical highs in emerging markets.1 Levels are lower in developed markets outside the US, but they remain a factor that investors should consider in portfolio management, in our view.2
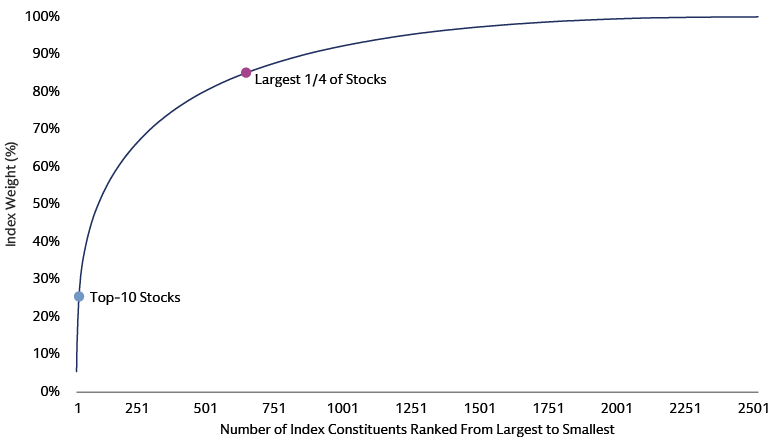
The importance of index concentration to investors owes partly to the global significance of US mega-cap stocks. Evidence of this can be seen by looking at the MSCI ACWI Index, a proxy for the global equity market comprising 23 developed markets and 24 emerging markets. The top five stocks in this index by weight are all listed in the US (Nvidia, Apple, Microsoft, Amazon, and Alphabet).3 Of the 10 largest companies, which account for just over 25% of the MSCI ACWI, only one – Taiwan Semiconductor Manufacturing – is based outside the US.4
In our work with clients, we are fielding a growing number of questions about index concentration as a portfolio construction challenge. One of the main concerns we are hearing is that elevated market concentration reduces the efficiency of active equity strategies designed to create diversified, long-only portfolios. As the combined weight of mega-cap stocks goes up, the weight of the remaining stocks in the benchmark index goes down. This hampers the ability of long-only strategies to express negative views about non-mega-cap stocks by limiting the potential to underweight these smaller names.
Index Concentration Can Hinder Efficient Portfolio Management
In a long-only equity portfolio, managers can express a positive view by taking an overweight position relative to the reference benchmark that can be increased in line with the strength of their conviction. The ability to express negative views is restricted, however. Underweighting a stock in a long-only portfolio means holding less of it. The limit is reached when a stock’s underweight position is equal to its benchmark weight (i.e., the stock is not held at all), irrespective of the strength of a manager’s negative view. This results in a lower transfer coefficient, which measures active managers’ efficiency in translating their investment expectations into portfolio weights.
The long-only constraint can also affect managers’ ability to express their positive views. To overweight a stock, the manager needs to underweight others by the same amount, because the underweights and overweights must add up to zero. When an index is concentrated, a small number of constituents have lopsided index weights. This can create challenges for a manager of a long-only portfolio seeking to offset the impact of overweighting stocks. For example, three-quarters of the stocks in the MSCI ACWI Index cumulatively account for just 15% of the index by weight.5 Underweighting all these stocks would therefore free up only 15% to apply toward overweight positions elsewhere in the index. In this situation, managers may need to underweight larger constituents of a concentrated index to more fully express their positive alpha views, especially in a strategy with higher tracking error that allows bigger bets. However, underweighting these larger stocks for a structural reason rather than for an alpha reason may be an inefficient use of a portfolio’s tracking error.
Source: Goldman Sachs Asset Management, MSCI. As of May 29, 2026. For illustrative purposes only.
We believe investors with some flexibility in setting risk budgets and formulating portfolios could benefit from two implementation options that can help address the challenges of index concentration.
Managing Concentration With a Low-Tracking-Error Approach
The first option is a low-tracking-error strategy that allows modest deviations from the benchmark. Compared with a higher tracking error portfolio, this approach scales down a long-only portfolio’s active weights, making the long-only constraint less binding. As a result, the impact of a given level of index concentration declines. By running a portfolio tighter to the benchmark, managers can diversify across active weights more efficiently, which may lead to more consistent performance and higher risk-adjusted outperformance, in our view.
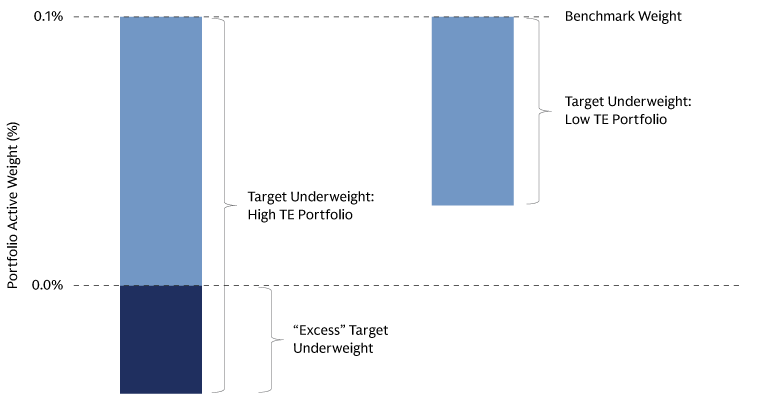
The potential advantages of a low-tracking-error strategy are illustrated in the diagram below for a single “unattractive” stock with a benchmark weight of 0.1%. For a high-tracking-error portfolio, suppose the manager would like to underweight the stock by more than its benchmark weight (the target underweight for the stock depicted on the left side of the chart). This is not possible for a long-only portfolio, however. Instead, to achieve the high-tracking-error objective, the manager would need to identify one or more alternative, less unattractive stocks to underweight. But doing so could reduce the portfolio’s efficiency (the expected excess return per unit of tracking error).
For a low-tracking-error portfolio, by contrast, suppose the target active weights are proportionately smaller, and hence less likely to exceed the benchmark weight (the target underweight for the stock depicted on the right side of the chart). Because the manager of a low-tracking-error strategy is not forced to identify alternative stocks to underweight, the portfolio’s efficiency is preserved compared to that of a high-tracking-error strategy.
A low-tracking-error strategy will generally be more efficient than a high-tracking-error strategy, but when the benchmark index is highly concentrated, as many equity indices are today, the benefits of a low-tracking-error approach are that much greater.
Source: Goldman Sachs Asset Management. For illustrative purposes only.
Extension Strategies: A Little Short Can Go a Long Way
A second option for investors seeking to manage the impact of index concentration is to relax the long-only constraint, allowing leverage with a long/short extension strategy. While we understand this may not be possible for some investors because of internal investment guidelines or other reasons, this approach may be suitable for clients seeking to take greater active risk in pursuit of higher potential returns. Where it is possible, we believe giving managers this added flexibility can dramatically improve a portfolio’s efficiency (its excess return per unit of tracking error).
If short positions are allowed, a stock’s benchmark weight does not limit the magnitude of its underweight, removing the structural need to underweight large-cap stocks to take active bets elsewhere. We believe this allows managers to more fully express their negative views about small- and mid-cap stocks, and thus better capture their investment insights – both positive and negative – across the entire stock universe.
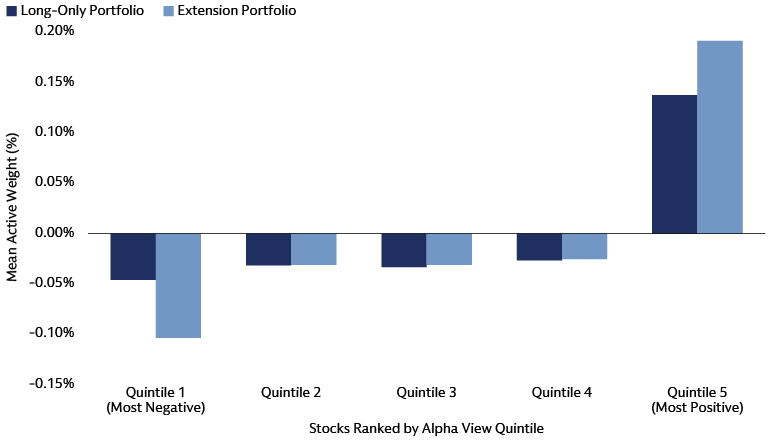
The benefits of relaxing the long-only constraint are illustrated in the chart below, which shows the mean active weight by alpha quintile for two sample portfolios, one long-only and the other long/short. Both portfolios target a tracking error of 3% versus the MSCI ACWI Index.
The chart highlights two key results. Firstly, for the long-only portfolio in dark blue, the mean active weight of the least attractive stocks (alpha quintile 1) is only slightly more negative than the mean active weights for the three middle alpha quintiles. Ideally, the underweights of the quintile-1 stocks would be much greater than the underweights of the stocks in quintiles 2, 3, and 4. Given the long-only constraint, however, this is often not possible. In contrast, the extension strategy is able to take much larger underweight positions in the least attractive stocks, consistent with the manager’s alpha views.
Secondly, because the extension strategy can take larger underweight positions in the least attractive stocks, it can also take larger overweight positions in the most attractive stocks for the same amount of active risk. As the chart shows, the mean active weight of the stocks in the top alpha quintile is larger for the extension portfolio compared to the long-only portfolio. For this reason, the expected return of the extension portfolio is greater than the expected return of the long-only portfolio even though the target tracking errors for the two portfolios are identical.
Source: MSCI, Goldman Sachs Asset Management. Benchmark: MSCI ACWI. Sample portfolios as of May 29, 2026. For illustrative purposes only. This illustration is provided for educational purposes only and should not be construed as investment advice or an offer or solicitation to buy or sell securities.
By weakening the structural link between index weights and active weights that exists for many long-only strategies, extension strategies enable active weights to be distributed along the size spectrum in a more uniform manner. For a fixed level of tracking error, we observe that long/short implementations have a more balanced distribution in the proportion of active share by market cap. For example, consider the pair of global sample portfolios presented in the chart above. While active bets funded from the smallest 40% of companies represent only 8% of the active share for the long-only portfolio, this rises to 16% for the extension portfolio. Active bets funded from the largest 20% of companies fall from nearly two-thirds of the active share of the long-only portfolio to approximately one-half of the active share of the extension portfolio.
A Data-Driven Approach Can Better Reflect Active Views and Control Risks in Low TE or Extension Strategies
The implementation options we have examined here – a low-tracking-error approach that aims to limit the divergence of a portfolio’s risk profile from its benchmark, or one that employs some amount of leverage and permits short positions – allow portfolio managers to diversify their active bets across the benchmark, avoiding concentrated sources of expected returns or unintended risk exposures that could come from structural underweights to mega-cap stocks. These implementations enable a better reflection of active views because portfolio risk and return are more frequently driven by sources of alpha, such as proprietary investment signals, rather than bets on industries, styles, or size metrics that come with concentration. As a result, we believe these strategies may make portfolios more efficient in navigating benchmark concentrations, with potentially higher risk-adjusted outperformance profiles.
We believe these implementations are well suited to data-driven investment processes, which offer breadth, versatility, precision, and systematic risk control. In particular, we favor quantitative approaches with diverse sources of data, ample coverage of the investment universe, a thoughtful approach to mega-cap risk modeling, and continuous research efforts to adapt to market evolutions.
While fundamental managers may excel at deep, idiosyncratic research on a limited number of names, the structural requirements of low-tracking-error and extension mandates favor the scalability and objectivity of quantitative models. Given their versatility, quant approaches can seek outperformance in a risk-controlled manner, while their broader scope can help diversify risk sources across the full investment universe as necessary in a low-tracking-error set-up. Extension strategies require precise balancing of long and short exposures to maintain a net 100% equity position within a specific tracking error budget. By explicitly managing unwanted exposures, systematic processes can help ensure that every dollar of active risk is spent on bets with the highest expected return.
1 In the US, the index weight of the top 10 stocks in the S&P 500 Index stands at 39.3%. See “S&P 500 Factsheet,” S&P Global. As of May 29, 2026. In emerging markets, the index weight of the top 10 stocks in the MSCI Emerging Markets Index stands at 39%. See “MSCI Emerging Markets Index Factsheet,” MSCI. As of May 29, 2026.
2 The top 10 stocks in the MSCI World ex USA Index, which covers 22 developed-market countries excluding the US, account for 12.2% of the index. See “MSCI World ex USA Index Factsheet,” MSCI. As of May 29, 2026.
3 For the MSCI ACWI, see “MSCI ACWI Index Factsheet,” MSCI. As of May 29, 2026. For the S&P 500, see the S&P 500 Factsheet, S&P Dow Jones Indices. As of May 29, 2026. In both cases, the fifth stock in the ranking is Alphabet A. The company’s Class A shares allow shareholders to vote on corporate matters, whereas its Class C shares do not.
4 “MSCI ACWI Index Factsheet,” MSCI. As of May 29, 2026.
5 Goldman Sachs Asset Management, MSCI. As of May 29, 2026.