The New Emerging Market Reality: Stronger Foundations, Broader Horizons




Key Takeaways
EMs have long carried a familiar set of assumptions. Higher volatility than developed markets (DMs). Policy frameworks are prone to unpredictability. Economies are vulnerable to the ebbs and flows of global trade, US dollar dynamics, and commodity prices. Some of these perceptions had merit. We believe many no longer carry the same weight. The picture today is different, in our view, and so is the investment case.
Across both equity and fixed income, we believe the EM investment landscape has broadened and deepened in ways that demand a fresh look—potentially bringing genuine diversification benefits and exposure to structural growth themes. Yet EMs remain under-owned, on the periphery of portfolios, and undervalued relative to their fundamentals. We believe it is time to re-evaluate the opportunity set.
Stronger on Balance, Diverse in Nature
We view the EM universe as stronger on balance than it has been in decades, though we acknowledge divergence at the country and corporate level remains significant within EMs relative to DMs.
At a macro level, the structural evolution of EM monetary policy has decoupled local policy cycles from historical US dollar constraints. Rather than mimicking the Federal Reserve's pro-cyclical actions, EM central banks have established greater institutional credibility. We believe this autonomy is anchored by two key shifts:
- Deeper local-currency debt markets that reduce foreign-currency exposure and balance-sheet vulnerability
- Robust reserve buffers that are increasingly diversified, with the US dollar playing a decreasing role
Consequently, flexible exchange rates now function as macroeconomic shock absorbers rather than catalysts for balance-sheet distress. This insulation grants EM policymakers the operational flexibility to run proactive, data-driven inflation-targeting regimes tailored strictly to domestic cycles.
In our view, the lines between DM and EM are increasingly blurring. Many DMs are carrying their own constraints. Rising fiscal deficits, sticky inflation, and elevated term premia in major advanced economies present non-negligible fiscal and duration risks. Conversely, many EM economies exhibit robust macro fundamentals, conservative fiscal management, and enhanced structural resilience. We believe this backdrop challenges the traditional binary view of treating EMs as inherently "risky". Instead, it reframes EMs through a classic investment lens: analyzing which economies can absorb shocks, which may benefit from them, and where investors are being adequately compensated for taking on genuine risk.
The two largest EM economies, India and China, warrant close consideration, each with a distinct macroeconomic story. India remains the fastest-growing major economy, with a resilient and relatively shielded domestic growth profile underpinned by a deep and sticky domestic capital base.1 A steady and long-running decline in India's oil consumption intensity has aided the country’s economic resilience in 2026 amid the war in Iran and energy supply shock.2 China’s economy remains highly bifurcated: the property sector and weak domestic consumption continue to act as persistent drags, while high-tech sectors are driving export strength.3
Beyond India and China, the divergence between well-anchored and fragile EM economies remains wide. Several economies are undergoing or potentially on the cusp of positive structural change—driven by political transitions, policy reforms, and improving institutional credibility. Examples include countries such as Hungary, South Africa, and Colombia. A number of frontier economies across Asia and Africa, including Sri Lanka, Ghana, and Nigeria, are experiencing ongoing reforms that are strengthening fiscal sustainability, external balances, and investor confidence, creating the potential for further spread compression and rating upgrades. Other markets, such as Brazil, have moved the other way, and recent volatility over fiscal deterioration fears is a reminder to stay alert to all scenarios around elections.
The picture at the corporate level is similarly varied, though the direction of travel has broadly improved alongside the macro backdrop. EM balance sheets are healthier than in previous cycles, on average, with lower debt and a rising share of domestically generated revenue. Many EM corporates show low currency volatility as they have strengthened hedging practices and reduced FX mismatches over time. Earnings in EM regions have continued to be revised up in recent quarters, with both 2026 and 2027 estimates soaring. A large part of the surprise has been driven by South Korean and Taiwanese technology companies exposed to AI, but strong results from financials, industrials, and energy have also contributed meaningfully.4 Elsewhere, India’s robust macroeconomic expansion continues to translate into steady double-digit percentage corporate earnings growth.
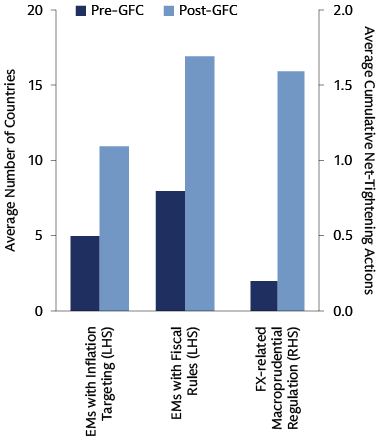
Source: IMF, World Economic Outlook. As of October 2025. The pre-GFC period is 1997–2009, and the post-GFC period is 2010–2024. Inflation targeting and fiscal rules are shown on the left-hand side (LHS); macroprudential policies are shown on the right-hand side (RHS).
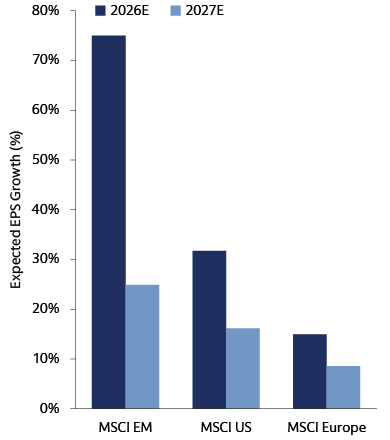
Source: Consensus EPS Growth Expectations, FactSet, MSCI, GIR, for MSCI EM, MSCI USA and MSCI Europe Indices in USD. As of September 30, 2026.
Sitting alongside these stronger macro and corporate fundamentals, some EMs—including Brazil, India, and South Africa—are seeking to shore up their economies by adopting a stance of strategic neutrality in an increasingly multipolar world. These nations are diversifying their trade, investment, and diplomatic relationships rather than aligning strictly with either the US or China, maximizing economic leverage while insulating themselves from geopolitical shocks. This comes amid a structural commodity upswing: AI and energy transition demand for copper, lithium, and nickel, combined with years of underinvestment in new supply, is supporting terms of trade, export receipts, and fiscal revenues across commodity-exporting EMs.5
From an oil market perspective, the impact of the closure of the Strait of Hormuz varies significantly by country—particularly among Gulf Cooperation Council nations—and depends on two primary factors: first, the volume of export losses, which differs by nation; and second, the price realized for any oil barrels successfully exported from the region. Central and Eastern European EM markets exhibit the highest sensitivity to natural gas prices.6
A More Dynamic Opportunity Set
We believe the scale of the EM transformation is striking, but the evolution in the makeup of equity and fixed income markets matters more to portfolio construction.
We believe EM debt represents a core fixed income opportunity set rather than a niche allocation. Close to 70 countries are represented in the J.P. Morgan EMBI Global Diversified Index alone.7 Sovereign and corporate debt behave differently; hard and local currency carry different risk and return profiles. EM debt has only moderate correlations with major asset classes like US Treasuries and the S&P 500, highlighting its potential diversification benefits.8 Frontier market sovereign and quasi-sovereign issuers add to EM debt opportunities for investors seeking high carry and income potential and who can withstand higher risk and volatility. Many of these next-generation EMs, including Ivory Coast, Nigeria, Paraguay, and Uzbekistan, have been pursuing structural reforms to strengthen macroeconomic frameworks and unleash their full economic potential.
In the equity market, the MSCI EM Index now covers 24 countries, and nearly 1,200 constituents worth some $11.7 trillion.9 The benchmark has outgrown its largely commodities-and-financials roots to span companies that supply critical minerals to both AI and the energy transition (Chile, Brazil, Indonesia), the AI hardware complex (Taiwan, South Korea), digitization and domestic-demand consumer growth (India), and advanced manufacturing and technology innovation (China). EM equity valuations remain low at ~10X forward P/E, albeit with wide disparity across EM markets, and trade at a meaningful discount to the US (~19.5x) and other DM regions globally.10
We believe investors should consider a large and unconstrained EM equity investment universe, including off-benchmark exposure. This approach may allow investors to navigate concentration dynamics and target mispriced opportunities across a vast investable universe of some 6,000 companies, including agile small- and mid-cap businesses in new-economy sectors.11 With index constituent turnover running higher than in DM equity indices, we believe many of today’s benchmark names may also look different tomorrow, meaning it’s important to be nimble and adapt portfolios to changing dynamics.12
In fixed income, rather than relying on a static framework, we believe a dynamic allocation approach across EM sovereign, corporate, and local EM debt may help investors navigate index-level cyclicality and return dispersion. For instance, the EMBI Global Diversified Index tracks US-denominated bonds and comes with a longer duration profile, making it more sensitive to US macroeconomic data and Federal Reserve policy. The GBI-EM Global Diversified Index tracks local-currency-denominated government bonds and is more decoupled from US dollar credit risks and driven instead by local central bank policies, domestic inflation, and regional supply-demand dynamics. EM corporates typically issue shorter-maturity debt, giving the CEMBI Broad Diversified Index a different risk-return profile, with issuers diversified across sectors.
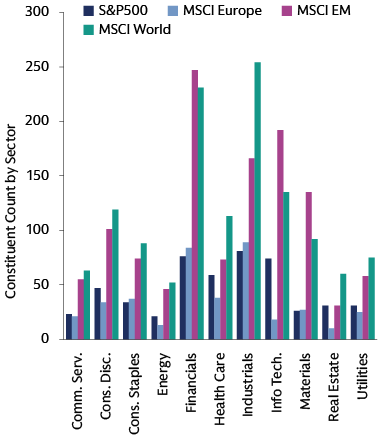
Source: Goldman Sachs Asset Management. S&P, MSCI. Respective benchmark constituents. As of July 31, 2026.
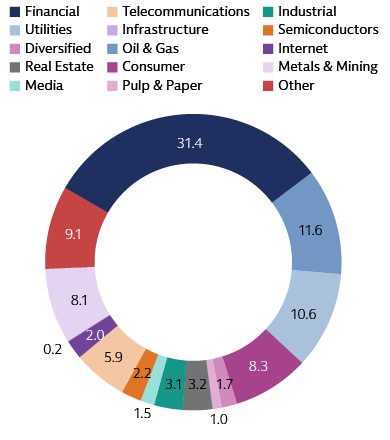
Source: J.P. Morgan CEMBI. As of September 30, 2026.
We believe volatility and dispersion remain the defining features of EMs. Some markets are shaped by energy sensitivities—importers absorbing inflation, exporters capturing windfalls—some by AI sentiment, supply chain shifts, and fiscal dynamics. Layered on top are rapid, sentiment-driven equity market dislocations and an unstructured yet rich data landscape, fragmented across dozens of languages, time zones, and disclosure regimes.
EM equity is also structurally under-researched relative to developed markets, with analyst coverage heavily skewed toward the largest index constituents and thinning rapidly further down the market-cap spectrum.13 This leaves much of the investable EM universe underexamined. Fewer market makers can result in wider bid-ask spreads and shallower liquidity; corporate governance standards and reporting conventions vary widely from market to market; and restrictions on currency convertibility complicate access in a number of countries. The consequence is an asset class that is mispriced more frequently, and slower to correct, than its developed market counterparts. For investors with local expertise and the ability to process unstructured data and local-language research, these persistent market inefficiencies may represent a rich source of alpha rather than an obstacle.
AI cuts multiple ways in EMs
North Asia equities
Select EM equity markets sit directly at the epicenter of the global AI build-out. North Asian leaders in Taiwan and South Korea are driving mission-critical hardware supply chains, from advanced semiconductor manufacturing and high-bandwidth memory (HBM) to server assembly and advanced packaging. Supported by technological leadership, operational excellence, and strong customer trust, corporate management teams are reporting robust, multi-year AI demand pipelines. While evolving market sentiment around AI capex may introduce short-term equity volatility, underlying structural tailwinds remain potentially compelling.
However, EM equity market concentration is at an all-time high. The combined weight of the top three stocks in the MSCI EM Index has now reached ~30%—a concentration level that is higher than that of the S&P 500 (~20%) and MSCI All World (~12%).14 This heavy skew is primarily driven by the rapidly growing weights of the IT and semiconductors sectors, dominated by powerhouse South Korean and Taiwanese technology giants, and reinforces the case for active management.
Increasing concentration in the MSCI EM Index driven by South Korean and Taiwanese tech firms
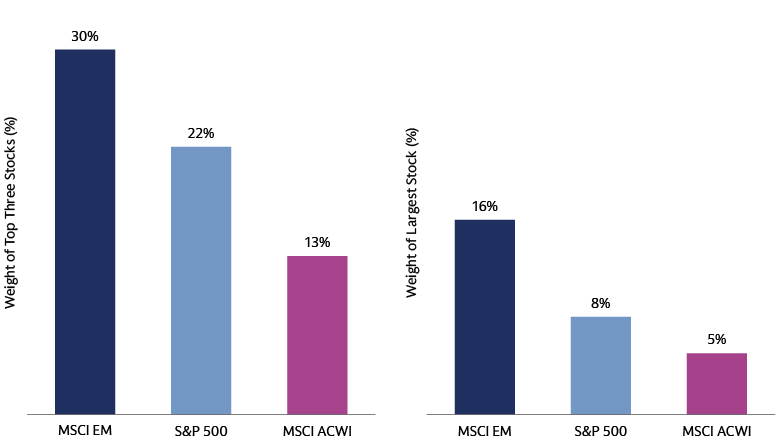
Source: FactSet, MSCI, Goldman Sachs Asset Management. As of September 30, 2026.
China equities
We believe China is another major player in the AI hardware supply chain. More broadly, the government continues to promote AI adoption and commercialization in key industries.15 The country is constructing a parallel AI stack entirely on its own, with domestic champions emerging across robotics, energy infrastructure, and battery components. We believe local expertise may potentially help identify investment opportunities early. Volatility is part of the profile, but in a market where structural shifts are recognized late, equity drawdowns have more often represented high-asymmetry entry points rather than reasons to step away.
India equities
India’s equity market offers a different kind of AI exposure, functioning as a potential diversifier. Its relatively insulated domestic macro profile, robust double-digit earnings growth, and low correlation to global AI hardware supply chains provide diversification.16 At the same time, India is building its own AI story as a leader in adoption of AI. Deep technical talent, leading usage statistics,17 agile small- and mid-cap IT players are creating opportunities for new use cases, and AI-enabled business models.18 Physical data infrastructure is also expanding, supported by central government provision of subsidized compute power to startups.
EM debt
For fixed income investors, EM debt—sovereign and corporate—seeks to offer participation in the AI cycle without crowding into its most expensive and concentrated segment (chips and models). A potential key reason is that AI investment in EM is financed differently:
- China: AI-related firms rely on internal funding and state support rather than public debt markets.19
- Middle East: AI investment is largely channeled through sovereign wealth fund capital.20
- Elsewhere in EM: AI-related capex is frequently financed via foreign direct investment rather than local bond issuance.21
Consequently, the EM corporate bond market remains shielded from the massive supply waves, potential circular financing risks, and valuation volatility seen in DM tech credit. And unlike DM tech credit, which is partly exposed to AI capex and monetization risk, EM's AI linkage runs through physical commodity demand, giving EM debt a distinct risk/return profile with lower correlation to swings in AI equity and credit valuations. That exposure is not uniform. We believe copper- and lithium-linked economies (e.g., Chile, Peru, and Indonesia) have a more direct "picks-and-shovels" linkage to AI infrastructure demand than the broader EM universe, allowing for active, research-driven alpha generation. Overall, for investors heavily exposed to the chips-and-models stage of AI elsewhere in their portfolios, we believe EM debt is not just a defensive hedge—it is a low-correlation way to invest in the global AI capex cycle.
An Active EM Advantage Opportunity
A broader, more dispersed opportunity set is not necessarily easier to capture. Diversity potentially raises the bar for the capabilities required to access opportunities. We believe a combination of expertise, networks, experience, and the ability to leverage data and scale may generate an edge in emerging markets. In our view, three factors matter most:
Seeking an edge in EM

From a fundamental investing standpoint, we believe an edge may be gained by a continuous physical presence across key regions. Corporate access may surface potential opportunities that global benchmarks often miss. This advantage is clearest in small- and mid-cap companies aligned with local innovation, and in high-quality IPOs evaluated on the ground months before benchmark inclusion. We believe regular, direct engagement with policymakers and local experts is also vital to monitor reform momentum and assess geopolitical event risks. Conversely, from a quantitative investing standpoint, an edge lies in an ability to track and translate data such as news reports, earnings call transcripts, audio, and web and app traffic, to determine what local EM networks are sharing, and how market participants are reacting in real time. This opens the possibility to identify patterns and exploit price dislocations that may evade other investors.

In our view, experience in capturing EM returns and navigating the volatility that comes with them is key. Some managers with multi-cycle track records across both equity and fixed income have built the pattern recognition to separate structural repricing from cyclical noise. We believe a cross-capital-structure perspective is also important to evaluate debt and equity, sometimes among the same issuers, to potentially identify the better risk-adjusted entry points. Ultimately, we believe investment decisions in EM should be grounded in fundamental judgment, while proprietary quantitative tools across equity and fixed income markets may help calibrate conviction levels and identify relative value opportunities.

EM information is fragmented by language, venue, disclosure standards, and time zone. And while corporate sell-side analyst coverage is thinner relative to DMs, there is no shortage of data. India, for example, publishes a wealth of weekly macro data. The task is less about finding data than the ability to structure, integrate, and leverage it. The signals that matter may also require regional nuances for market-specific dynamics, such as capturing policy-driven growth in China, or distinct flow-driven dynamics in Korea and Taiwan, where contrarian retail trading may bring some local informational advantages. Quantitative approaches using AI and machine learning tools may help parse local-language sources in real time, identify patterns before markets reflect them, and potentially help analyze data points across numerous regions and trading hours. A signal picked up in one market often needs a second lens, and the ability to draw on equity, credit, and macro expertise across markets can turn a data point into an investment view.
From Why Emerging Markets to How
The question for investors is no longer whether emerging markets have changed. Stronger policy frameworks, healthier corporate balance sheets, a debt universe spanning close to 100 countries, and an equity universe reaching well beyond the benchmark all point in the same direction. The question is what to do about it. We will continue to explore EMs, moving from the why to the how, and turning to the portfolio construction considerations that follow.
We are here to help you unlock emerging market opportunities across equity and fixed income.
1 IMF. As of July 2026.
2 CEIC, Goldman Sachs Global Investment Research. Oil consumption intensity as a % of nominal GDP. As of June 14, 2026.
3 CEIC, Goldman Sachs Global Investment Research. As of October 7, 2026.
4 Goldman Sachs Global Investment Research. As of August 7, 2026.
5 UN Trade & Development. As of June 2026.
6 FactSet, Goldman Sachs Global Investment Research. As of September 3, 2026.
7 Goldman Sachs Asset Management, J.P. Morgan. As of June 2026.
8 J.P. Morgan. As of end February 2026. Correlations are based on 10 years of monthly returns. J.P. Morgan EMBI Global Diversified J.P. Morgan GBI-EM Global Diversified, J.P. Morgan CEMBI Broad Diversified vs. Treasuries and S&P 500.
9 FactSet, Goldman Sachs Global Investment Research. As of October 8, 2026.
10 FactSet, Goldman Sachs Global Investment Research. As of September 3, 2026.
11 Goldman Sachs Asset Management. As of October 2026.
12 MSCI EM, US, World, and Europe Index Factsheets. 1 Year Turnover, %. As of July 31, 2026.
13 Bloomberg, MSCI. As of August 2026.
14 FactSet, MSCI, Goldman Sachs Asset Management. As of June 2026.
15 National People’s Congress (NPC), March 5, 2026.
16 MSCI, Goldman Sachs Global Investment Research. As of July 2026.
17 Deloitte. The State of AI in the Enterprise. As of April 2026.
18 Deloitte. The State of AI in the Enterprise. As of April 2026.
19 Rhodium Group. As of September 2026.
20 World Economic Forum. As of February 2026.
21 Goldman Sachs Global Investment Research. As of August 2026.