Private Equity Co-Investments: A Closer Look at an Evolving Landscape





Key Takeaways
The private equity co-investment market continues to expand, driven by the distinct advantages for both LPs and GPs. For LPs, co-investments offer the opportunity for more targeted portfolio construction, reduced fee loads, and potential for outperformance. For GPs, they provide expanded access to capital and foster stronger, more collaborative relationships with LPs, potentially enhancing future fundraising prospects. This momentum, however, raises several key questions:
- Are co-investments truly value-accretive for LPs, or primarily a mechanism for GPs to fill equity gaps in larger transactions?
- How vital is deal-level selection in achieving superior outcomes?
- Do specific GP characteristics correlate with better performance? For instance, does the narrative that sector specialists outperform generalists hold true? And does partnering with GPs with higher fund-level loss ratios compromise returns?

A private equity co-investment is a direct investment made alongside a private equity sponsor (GP) into a specific portfolio company, rather than through the sponsor's main fund. Co-investments are typically offered to the sponsor's existing limited partners (LPs) and often carry reduced or no management fees and carried interest.
Methodology and respondents
Our analysis of over 230 private equity buyout co-investment opportunities from 135 different managers between 2015 and 2022 (encompassing both executed and declined deals where GSAM’s External Investing Group receives ongoing reporting as a proxy for broad industry activity) seeks to provide insights into these questions. The dataset represents 236 actionable co-investment opportunities identified between 2015 and 2022 that closed with an inviting Sponsor on the External Investing Group (“XIG”) platform and for which XIG receives available ongoing reporting from third party GPs. The dataset provides a representative view of the co-investment landscape based on XIG’s data, reflecting the full breadth of the opportunity set shown to XIG over the relevant time period rather than solely the transactions XIG invested in. Performance references and analysis stated herein may differ materially if relying on a broader industry-wide universe of co-investment opportunities. (Please see end for additional disclosures related to the dataset and methodology of analysis.)
Performance and Dispersion
Evaluating co-investment performance relative to parent funds
Private equity co-investments have historically outperformed both their respective parent funds and the broader Cambridge Private Equity Fund Universe, achieving a 2.11x average net Multiple on Invested Capital (MOIC). This outperformance is most pronounced at the upper end of the distribution range: at the 75th percentile, co-investments have generated a 2.73x net MOIC compared to just 2.06x for the parent funds that offered them.
However, these headline metrics mask greater performance dispersion. The spread between the 25th and 75th percentiles is more than double that of net fund returns, underscoring that co-investing on a select basis could introduce a level of volatility that headline averages obscure. While 58% of co-investments outperform the parent fund on a net basis, the risk of underperformance on any given individual deal still exists.
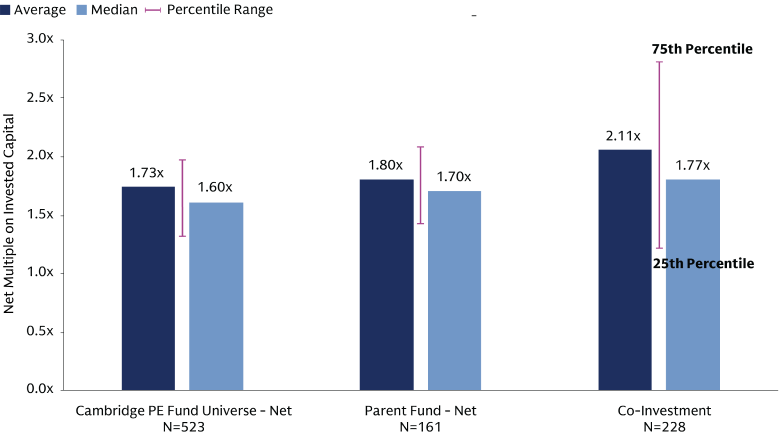
Source: Cambridge Associates and Goldman Sachs Asset Management. Performance data as of March 31, 2025; a subset of this data is as of December 31, 2024 or June 30, 2025 due to limitations in available data. The dataset represents 228 actionable co-investment opportunities identified between 2015 and 2022 that closed with an inviting Sponsor on the External Investing Group (“XIG”) platform and for which XIG receives available ongoing reporting from third party GP. A co-investment is included in this analysis only where corresponding ongoing reporting and data are also available for the associated parent fund. As a result, the dataset is smaller than the broader sample of 236 co-investment transactions analysed elsewhere in this paper. Each co-investment is given equal weighting for the purposes of the analysis. The corresponding parent fund level analysis covers 161 unique funds that presented these co investment opportunities. Cambridge PE Universe defined as 523 buyout funds across Europe and US, with vintage years from 2015 to 2022. Co-investment net returns are presented net of management fees and carried interest, but gross of underlying investment expenses. Parent fund net returns are presented net of all fees, carried interest, and expenses. Underlying expenses associated with each co-investment are typically de minimis, such that the exclusion of such expenses is not expected to materially impact the performance comparison to parent fund returns which are presented net of all fees, carried interest, and expenses. The effect of netting expenses within the co-investment dataset would nonetheless further reduce returns.

Co-investments are often marketed to LPs as a fee-efficient path to enhance net returns. Our analysis confirms that the “fee-free” component contributes to higher average net returns. However, fee savings alone do not guarantee success. Pursuing individual co-investments purely for cost savings without robust evaluation is a potentially risky strategy that may leave LPs exposed to disappointing outcomes compared to their primary fund performance exposure.
Specialists vs. Generalists
How sector focus may impact co-investment returns
Our analysis challenges a common assumption that sector specialization typically delivers superior results. While there are areas of notable outperformance, particularly in healthcare, consumer, and financials, the broader picture is more mixed. On a sector-agnostic basis, generalist GPs have delivered slightly higher median net returns (1.79x MOIC vs. 1.75x for specialists) and demonstrated lower volatility overall. However, specialist-led co-investments have delivered a higher 75th percentile, highlighting the potential for outperformance, albeit with more volatility.
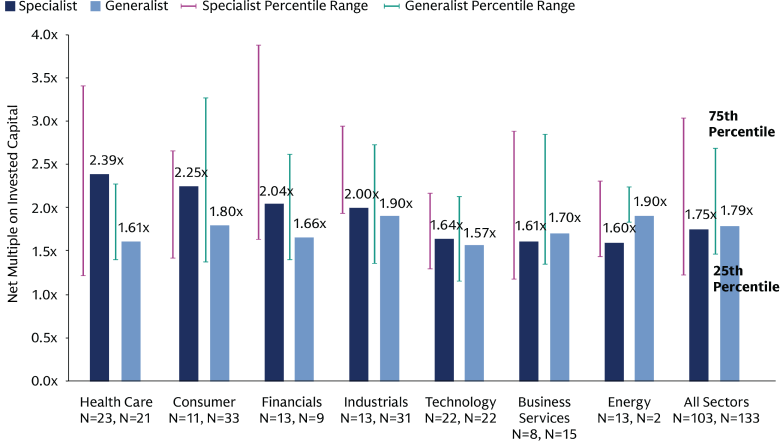
Source: Goldman Sachs Asset Management. Performance data as of March 31, 2025; a subset of this data is as of December 31, 2024 or June 30, 2025 due to limitations in available data. The analysis includes 236 actionable co-investment opportunities identified between 2015 and 2022 that closed with an inviting Sponsor on the External Investing Group (“XIG”) platform and for which XIG receives available ongoing reporting from third party GP. “N” represents the number of co-investment transactions included in each category. “Specialist GPs – All Sectors” represents the median return across all co-investments in the dataset alongside specialist GPs, irrespective of the underlying sector of the investment. Each co-investment is given equal weighting for the purposes of the analysis. Certain vintage year and sector analyses are based on relatively small sample sizes, and the findings should be interpreted in that context.
Digging deeper into the data, the highest performing co-investments (50 deals marked at or above 3.0x) are almost evenly split: 48% from generalists, 52% from specialists. Notably, a similar pattern emerges when examining downside risk - of the 40 deals marked below cost (i.e. less than 1.0x), investments were evenly split between generalist and specialist GPs. Neither overperformance nor underperformance is confined to any one group or sector; in fact, all sectors have been prone to outsized returns as well as losses.
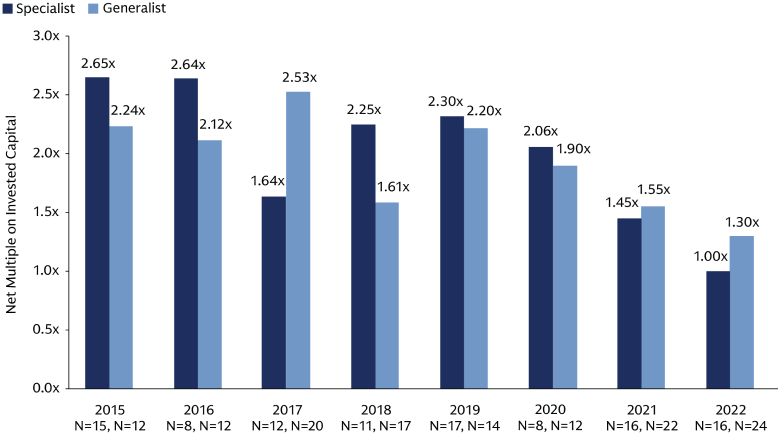
Source: Goldman Sachs Asset Management. Performance data as of March 31, 2025; a subset of this data is as of December 31, 2024 or June 30, 2025 due to limitations in available data. The analysis includes 236 actionable co-investment opportunities identified between 2015 and 2022 that closed with an inviting Sponsor on the External Investing Group (“XIG”) platform and for which XIG receives available ongoing reporting from third party GP. “N” represents the number of co-investment transactions included in each category. Each co-investment is given equal weighting for the purposes of the analysis. Certain vintage year and sector analyses are based on relatively small sample sizes, and the findings should be interpreted in that context.
Our analysis of co-investments across vintage years suggests that neither approach consistently outperforms the other. While specialist GPs may benefit from deep sector expertise, networks, and origination capabilities, their performance can be more closely tied to the dynamics of the sectors in which they invest, which may vary across market cycles. Generalist GPs, by contrast, may benefit from greater flexibility to allocate capital across a wider range of industries as opportunities evolve. Increasingly, many of today's largest generalist GPs have built substantial sector-focused teams and expertise of their own, blurring the lines of specialists and generalists. Ultimately, we believe, GP capabilities, investment discipline, and execution are more important drivers of performance than organizational labels alone.
We believe the most successful private equity co-investment programs are underpinned by robust resources, deep expertise, disciplined selectivity, thorough GP evaluation and a broad sourcing network.
The Impact of GP Loss Ratios
We also examined the relationship between a GP’s fund-level loss ratio and the performance of its associated co-investments. Our review considered the loss ratio of the GP’s fund that offered the co-investment and where available, the predecessor fund of the same GP. We categorized the loss ratios into three bands: low (<10% capital loss), medium (10–20%), and high (>20%).
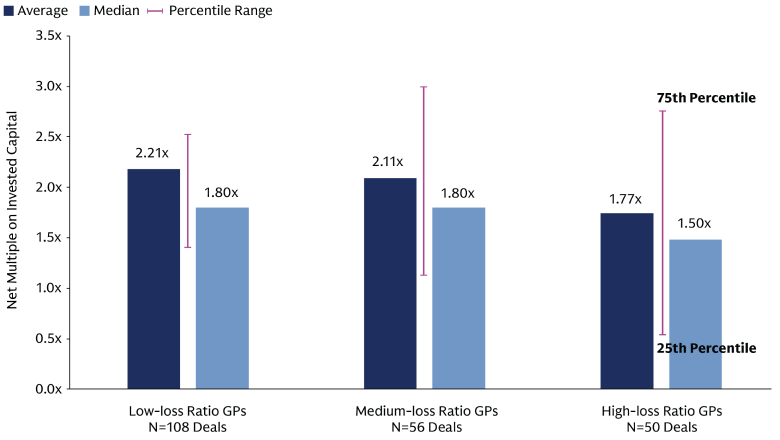
Source: Goldman Sachs Asset Management. Performance data as of March 31, 2025; a subset of this data is as of December 31, 2024 or June 30, 2025 due to limitations in available data. The analysis includes 214 actionable co-investment opportunities identified between 2015 and 2022 that closed with an inviting Sponsor on the External Investing Group (“XIG”) platform and for which XIG receives available ongoing reporting from third party GP. Each co-investment is given equal weighting for the purposes of the analysis. “N” represents the number of co-investment transactions included in each category. A co-investment is included in this analysis only where corresponding ongoing reporting and data are also available for the associated parent fund. As a result, the dataset is smaller than the broader sample of 236 co-investment transactions analysed elsewhere in this paper. The GP Loss Ratio is calculated ‘by cost’ as the proportion of invested capital that is marked or realized below 1.0x net MOIC. For example, if $100m was invested in an investment currently valued at 0.8x ROI, then $20m would be classified as a loss. Loss ratios were grouped into three bands: “Low” for losses of less than 10% of capital, “Medium” for losses between 10-20% of total capital, and “High” for losses exceeding 20%.
Private equity co-investing alongside GPs with low fund-level loss ratios has, on average, delivered stronger net returns with less volatility. In contrast, co-investments sourced from medium and high-loss ratio GPs are characterised by higher unpredictability. And while net returns for the 75th percentile for medium- and high-loss ratio managers is higher (3.03x and 2.79x, respectively) than for low loss ratio managers (2.51x), the 25th percentile is significantly lower.
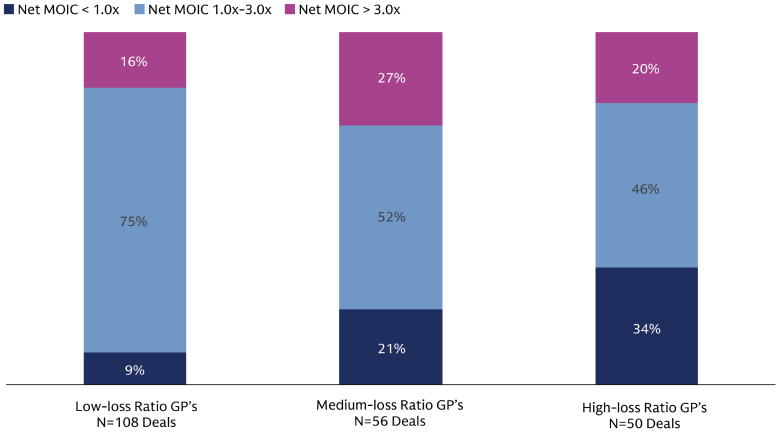
Source: Goldman Sachs Asset Management. Performance data as of March 31, 2025; a subset of this data is as of December 31, 2024 or June 30, 2025 due to limitations in available data. The analysis includes 214 actionable co-investment opportunities identified between 2015 and 2022 that closed with an inviting Sponsor on the External Investing Group (“XIG”) platform and for which XIG receives available ongoing reporting from third party GP. “N” represents the number of co-investment transactions included in each category. A co-investment is included in this analysis only where corresponding ongoing reporting and data are also available for the associated parent fund. As a result, the dataset is smaller than the broader sample of 236 co-investment transactions analysed elsewhere in this paper. The GP Loss Ratio is calculated ‘by cost’ as the proportion of invested capital that is marked or realized below 1.0x. For example, if $100m was invested in an investment currently valued at 0.8x ROI, then $20m would be classified as a loss. Loss ratios were grouped into three bands: “Low” for losses of less than 10% of capital, “Medium” for losses between 10-20% of total capital, and “High” for losses exceeding 20%.
Additionally, we looked at the mix of returns within each category. Among the 50 co-investments sourced from high loss ratio GPs, 34% were marked below cost, while 20% have achieved net returns above 3.0x. In contrast, co-investments alongside low loss ratio GPs show a more stable profile: only 9% of their 108 co-investments were marked below cost, with 16% surpassing the 3.0x threshold. When evaluating co-investment opportunities with GPs who have a track record of high historical losses, we believe a prudent and cautious approach is essential, especially when making only a few, select co-investments alongside such managers, rather than taking a “portfolio approach.”
To note, we also explored the impact of several other GP attributes on private equity co-investment performance, including the growth in fund over fund size as well as the proportion of the GP’s fund-level check size relative to the total equity invested into any given deal. Our findings indicate that neither factor provides significant evidence of any detrimental impact on co-investment performance.
Risk, Reward, and the Need for Selectivity
The private equity co-investment market continues to expand offering meaningful benefits for investors when approached with discipline and rigorous analysis. Co-investments can potentially enhance net returns and serve as a valuable strategic tool, but success depends heavily on selectivity and thorough GP evaluation. Access to a broad ecosystem and a deep roster of managers from which to source a high volume of opportunities is critical to a successful private equity co-investment program. By prioritizing asset selection and pattern recognition in GP relationships over the pursuit of fee savings alone, we believe LPs can better position themselves to capture the full potential of co-investment strategies.
Additional disclosures related to the dataset and methodology of analysis and the limitations of the data.
Performance references and analysis stated herein may differ materially if relying on a broader industry-wide universe of co-investment opportunities. Co-investment returns referenced throughout this research paper are shown net of management fees and carried interest, but gross of underlying investment expenses. Underlying expenses associated with each co-investment are typically de minimis, such that the exclusion of such expenses is not expected to materially impact the performance comparison to parent fund returns which are presented net of all fees, carried interest, and expenses. The effect of netting expenses within the co-investment dataset would nonetheless further reduce returns. Performance data as of March 31, 2025; a subset of this data is as of December 31, 2024 or June 30, 2025 due to limitations in available data. This material is provided for educational purposes only and should not be construed as investment advice or an offer or solicitation to buy or sell securities. Past performance does not predict future returns and does not guarantee future results, which may vary.