Taking the High Road: Investing in a Higher-for-Longer Rate World
When a car battery runs out of charge and your vehicle fails to start, knowing the art of a push start is a useful skill. In some ways, popping the clutch on a car is not all that different from trying to generate sufficient momentum in an economy. Major central banks have attempted economic jump starts of their own in recent years using unprecedented monetary and fiscal stimulus, largely in response to pandemic disruptions, supply chain shifts and labor market dislocations. But like push starting a car, this transition is often accompanied by moments of violent friction and surprising consequences in the form of inflation and restrictive monetary policy. We think investors must now prepare to navigate a road that brings new risks but also a broad set of opportunities. In this article, we focus on some of the potential implications for equity and bond investors in a world where rates may stay higher for longer.
Equities: Different Return Drivers
We expect the equity market to become more idiosyncratic and discriminating in the years ahead. The burden of higher interest rates and cost of capital suggests opportunities for alpha generation may not only become more global but also more bottom-up and determined by profitability. When money is cheap, as it was pre-pandemic, companies often borrow to grow revenues. But when money is expensive, as it is now, companies often sacrifice unit growth for profit growth.
Rear-View Mirror: A Look Back at Equity Super Cycles
Arguably there have been three equity ‘super cycles’, or secular bull markets, since the end of the second world war—1945-1968, 1982-2000 and 2009-2020. Each cycle shows a combination of one or more of the following: very strong growth, falling interest rates, low starting valuations together with rising profit margins. While these conditions were conducive to strong returns in equity markets, risk premium also declined as risks to the global system faded. New international institutions and a rule-based global trading system emerged.
During the 1945-1968 super cycle, the establishment of the International Monetary Fund (IMF) and the World Bank, as well as the Bretton Woods monetary system, helped to reduce uncertainty. Meanwhile, global trade expanded on the back of stronger institutional frameworks, such as the 1948 General Agreement on Tariffs and Trade (GATT), and later via the United Nations Conference on Trade and Development (UNCTAD), founded in 1964. By 1967, the negotiations had resulted in cuts to trade tariffs by an average of 35-40% on many items and were widely described at the time as “the most important trade and tariff negotiation ever held.”
The 1980s kicked off the next super cycle as global economies experienced a wide range of de-regulation, reform and privatization. In the US, the Economic Recovery Tax Act of 1981 brought in significant tax reform, which resulted in top-rate income taxes falling from 70% in 1980 to 28% in 1986. Non-defense spending also fell dramatically and several industries were de-regulated, including in the air transport and financial sectors. Similar reforms were instituted in the UK, alongside a comprehensive program of privatization of a wide array of assets, including utilities. The continuation of the re-rating of equities was spurred by the fall of the Berlin Wall in 1989 and, soon after, the unravelling of the Soviet Union.
Finally, in the most recent super cycle between 2009-2020, the combination of post-financial crisis regulations, implied moral hazard, negative yields, and quantitative easing ended up energizing equity beta. Having collapsed by 57% from its 2007 peak, the S&P 500 started a powerful recovery that was to result in one of the longest bull markets in history. Part of the strength of the recovery, as with that from the early 1990s, was a function of the scale of the declines in the economy and market that had preceded it. Between 2007 and 2010, the median wealth of a household in the US fell 44%, resulting in levels falling below those of 1969. Stock prices had also fallen sharply, leaving them relatively cheap and offering significant valuation expansion possibilities in light of the start of quantitative easing and the resulting collapse in financial conditions.
Today Looks Different
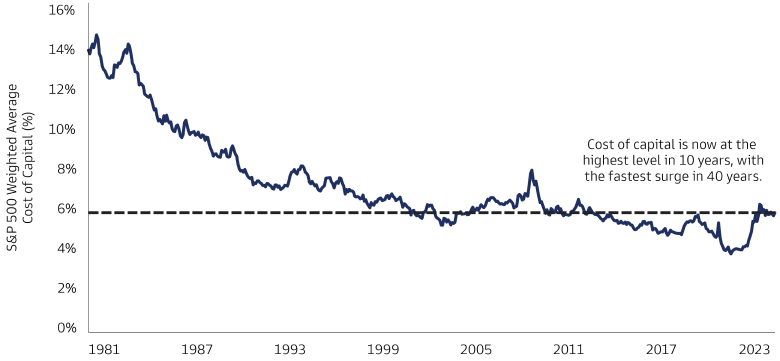
Each of these prior periods were interrupted by recessions, asset bubbles, and painful capital market adjustments. But the starting point of each enjoyed tailwinds of rising valuations and lower interest rates. Low-cost beta was sufficient equity exposure. The S&P 500 experienced strong returns throughout these super cycles as normalizing valuation, margins, and sequentially lower interest rates did most of the heavy lifting. Meanwhile, today’s equity backdrop looks different: while investors can debate where we might fall in the current cycle, capital markets face a more challenging landscape of both high equity valuations and high interest rates contributing to the highest cost of capital seen in a roughly a decade.

Bloomberg and Goldman Sachs Global Investment Research. As of August 31, 2023.
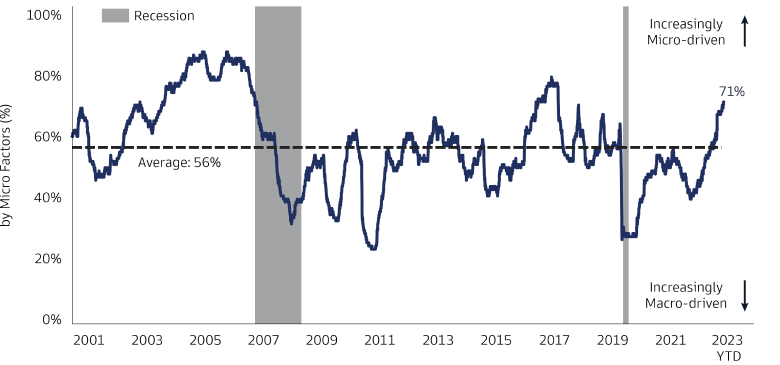
As rates have moved from low to high, we believe investors should recognize several factors that may influence their equity positioning. First, we think equity returns today are unlikely to achieve those of prior super cycle levels. Our models suggest US equity returns of roughly 8% range over the next decade.1 We have shifted from a world in which There Is No Alternative (TINA) to equities to an environment in which There Are Reasonable Alternatives (TARA), namely high-quality fixed income assets such as investment grade (IG) corporate bonds. Second, we expect high interest rates to reorient market preferences from revenue growth to profitability. Alongside this, performance differentials between macro tilts—sector, style, size, and region—may become less extreme and, therefore, less alpha generative. Finally, equity allocations may benefit from higher active risk as markets become more micro-led. The opportunity set for alpha generation may improve across and within industries driven by a combination of new areas of innovation, disruption of non-tech industries, demand growth from green capex, and re-ratings due to artificial intelligence or companies opening new growth streams. Moderating returns combined with potentially higher volatility and return dispersion may enhance the ability to generate bottom-line savings through a heightened focus on tax-aware investing in equities.

Goldman Sachs Global Investment Research and Goldman Sachs Asset Management. As of July 31, 2023. Chart shows the share of the median S&P 500 stock's trailing 6-month return explained by micro factors. Micro factors refer to company specific sources of risk and return rather than macro factors such as market beta, sector beta, size, and valuation. Past performance does not guarantee future results, which may vary.
Fixed Income in Focus
We believe rapid increases in yields have revitalized the traditional role of bonds. In our view, investors can once again participate in the potential strategic benefits of fixed income by securing predictable future cash flow, establishing a functional equity volatility hedge, and improving return asymmetry.
Predictable Cash Flow
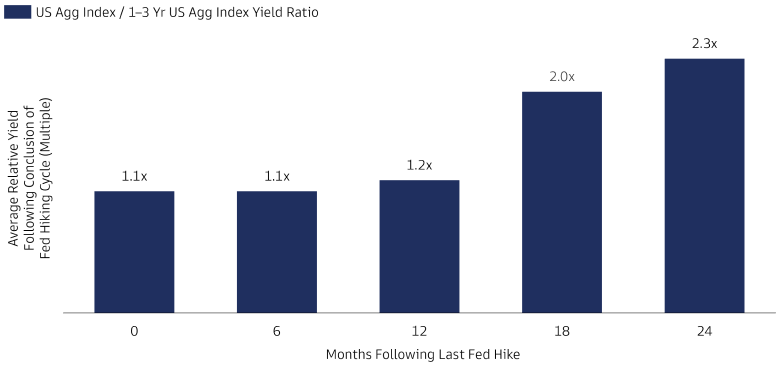
Federal Reserve (Fed) tightening cycles leave a somewhat predictable signature on the bond market by inverting the yield curve. This cycle has been no different, with short rates repricing at the fastest pace in decades. We believe the Fed is done with hikes and intermediate/long duration is normalizing from adversary to ally. To be sure, with the six-month Treasury bill rate at 5.55% and the 10-Year Treasury yield at 4.62%,2 the temptation to stay short-duration can be considerable, especially after a prior calendar year of losses. However, the Fed “pause” has been a reliable historical signal that the term structure of rates is poised to normalize, eventually reflecting the positive slope generated by term premia. Since 2000 this re-steepening process can take about 18-24 months, with the result being 2x the yield coming from the Bloomberg US Aggregate Bond Index versus the Bloomberg US Aggregate 1-3 Year Index. We believe current conditions across fixed income markets offer an attractive opportunity to secure attractive future cash flows.

Bloomberg and Goldman Sachs Asset Management. As of August 31, 2023. Past performance does not predict future returns and does not guarantee future results, which may vary.
Volatility Hedge
We believe that the hedging potential of intermediate-duration bonds has returned. The ability of a 10-Year US Treasury to hedge equity drawdown risk has directly increased as yields have increased. In fact, in a scenario in which rates fall back to 0%, a 10-Year US Treasury could hedge 30% of an equity drawdown in a 50/50 stock and bond portfolio, all else equal, resuming its role as a “stock absorber”. Of course, this scenario is unlikely, in our view, but renewed capacity for bonds to materially hedge equity tail risk is encouraging and emphasizes that investors can potentially build more risk-aware portfolios today now that yields are higher.
Improved Risk Asymmetry
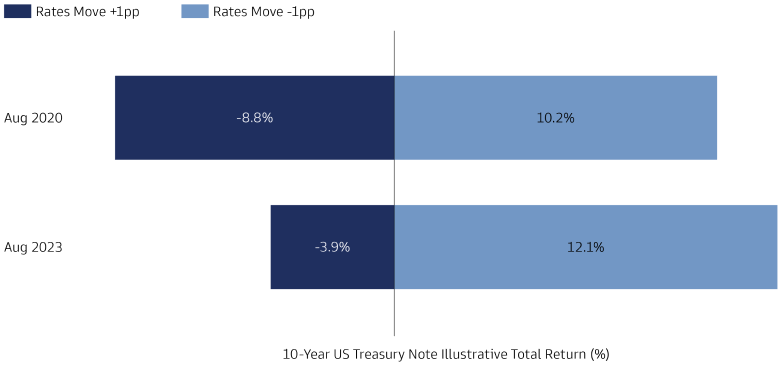
While many investors understand the appeal of extending duration, elevated cash yields suggest to us that few have truly returned to their strategic portfolio weights. However, beyond attractive yields, modest expected spread tightening, and a normalizing equity/bond return correlation, we find that implied return asymmetry in intermediate-duration bonds has significantly improved relative to the zero-interest rate world of 2020. We demonstrate this by observing the potential return on a 10-Year Treasury note in the event that the corresponding market interest rate moved by 1% in either direction (as shown in Potentially Better Return Asymmetry). In other words, we believe bond prices today are theoretically punished less if rates rise, and more importantly, that they are theoretically rewarded more if rates fall, which is more likely today compared with recent years.

Bloomberg and Goldman Sachs Asset Management. As of August 31, 2023. These examples are for illustrative purposes only and are not actual results. If any assumptions used do not prove to be true, results may vary substantially. Past performance does not predict future returns and does not guarantee future results, which may vary.
Shifting Gears
While we expect winners and losers in the transition from zero to high rates, we believe there is no sector with enough systemic heft to compromise an overall economic recovery, even as each sector faces higher costs of capital. In equities, we believe higher rates call for more idiosyncratic positioning and less reliance on macro inputs to generate alpha. In fixed income, we suspect current levels represent a timely opportunity to relinquish tactical overweights to cash equivalents in favor of a more neutral duration alignment with strategic benchmarks. Beyond push starts, we believe equity and bond investors must get back on the road and prepare for a higher rate world.
1Goldman Sachs Asset Management Multi-Asset Solutions long term capital markets assumptions. Alpha and tracking error assumptions reflect Multi-Asset Solutions’ estimates for above-average active managers and are based on a historical study of the net-of-fee results of active management. Strategic long-term assumptions are subject to high levels of uncertainty regarding future economic and market factors that may affect future performance. They are hypothetical indications of a broad range of possible returns. All numbers reflect Multi-Asset Solutions’ strategic assumptions as of June 30, 2023. Please see additional disclosures.
2Rates as of October 13, 2023.
