Market Know-How 3Q 2026

Key Takeaways
The Geo Paradigm
Investors can no longer treat geopolitical shocks as temporary, cyclical disruptions. Instead, forces like economic security, supply-chain redesign, and industrial policy have become permanent, structural features of the global investment landscape.
Consequently, geopolitical shocks now yield vastly different outcomes. Resilient economies with strategic flexibility have the potential to thrive, while those reliant on concentrated external supply chains face heightened risk.
This edition of Market Know-How explores why the divergence driven by this "Geo Paradigm" matters for economies and portfolios. We also consider potential investment opportunities across:
Public Equities: Europe high-dividend equities provide resilience.
Fixed Income: Global flexible bonds help navigate during uncertain times.
Alternatives: Liquid Alts offer diversification through volatile market regimes.
Short-Term Macro Themes
We expect the global economy to remain resilient, with global growth just below potential and inflation remaining relatively contained, assuming that Persian Gulf exports normalize to pre-war levels by the end of July. That said, risks remain two-sided, depending on the speed of the supply recovery, stickiness of demand losses, and the ripple effects on supply chains. Regardless, we expect an acceleration in both private and public investment in the near future.
The Middle East Crisis: Manageable Scarring, Structural Shift
- The economic scarring from the Middle East crisis looks manageable if the Strait of Hormuz reopens per the June 14 US-Iran deal. Most lost supply should recover within months — according to our estimates, normalizing Gulf exports to 23mb/d requires only a 13mb/d increase in Hormuz flows, roughly 70% of pre-war throughput,1 and we expect that to be achieved by end of July.2 This should allow the global economy to grow just below potential this year, and inflation to remain relatively contained, though the return to the 2% target will be delayed by at least a year, which is quite remarkable considering that the IEA has defined this as the largest supply disruption in the history of the global oil market.3
- This is because the global economy never absorbed the full headline shock. Strategic reserve releases (400mb IEA SPR of which 172mb is US), inventory drawdowns, higher non-Middle East production, alternative shipping routes, and most of all lower Chinese imports (around 4 mb/d) all cushioned the blow.
- The macro signal this time is fundamentally different. Economies have remained resilient despite the destruction of 4-5 mb/d of oil demand because a meaningful share of that demand reduction came from substitution, not forgone activity. That distinction matters enormously and it is largely the result of lessons from previous oil crises.
- In 1973, oil was embedded across the entire economy—power generation, transport, industry—with poor vehicle efficiency, limited alternatives, and no fallback infrastructure. The result was a recession, inflation, and a lasting restructuring of global energy systems. Today, much of the modern energy infrastructure exists precisely because of those vulnerabilities.
- With two major energy crises in quick succession and a geopolitical environment increasingly shaped by competition over resources and economic security, the stage is set for an acceleration in capex upcycle and a deeper structural decoupling of economic activity from oil.
Fiscal Buffers, Structural Limits
- Fiscal policy has been a contributing factor in supporting growth through the current crisis, with most affected countries announcing measures to temporarily cushion consumers from the full extent of the energy price increases. But concerns around debt sustainability have become more prominent recently, as evidenced by the sharp rise in long-term yields across most countries since the start of the war, which have primarily been driven by real rates.
- In the US, war-related expenditures have been substantial and tariff revenues have come in below expectations as a result of the Supreme Court’s decision to nullify some of the tariffs imposed by the Trump administration, adding to deficit pressures. At the same time, AI investment could prove inflationary in the short term, until productivity gains catch up. With the midterm elections fast approaching and the recent energy price shock, we think that more affordability measures could be announced over the coming months.
- In the UK, reduced fiscal headroom has narrowed the scope for further stimulus, even as the economic backdrop has weakened in Q2, and pressure to scale up defense spending has intensified. The government remains exposed to Gilt yields, which could stay elevated given ongoing political uncertainty, further squeezing the already limited room for manoeuvre.
- In Japan, PM Takaichi avoided new issuance in the supplementary budget, though her forthcoming growth plan could carry inflationary implications if effective demand is prioritized at the expense of intangible investment. Finally, in Germany, last year’s fiscal stimulus continues to be deployed, but weakening coalition support raises questions about its continuity.
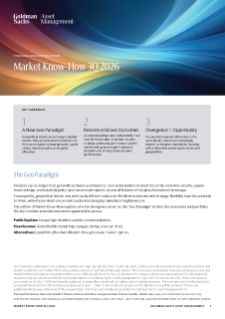
- Looking ahead, this investment cycle may look different from the past. Previous spikes in geopolitical risk typically saw private investment retreat as uncertainty spiked, with defense and government spending rising only with a lag. Today, the drivers are different and less discretionary. AI is fueling a new wave of private-sector capital spending. Energy security and geopolitical competition are triggering a synchronized surge in public investment. Supply chains are being rebuilt for resilience, pushing up capital intensity and shifting the growth model from capital-light to capital-heavy. The combination of higher private capex demand to fund the AI boom, and a growing need for governments to borrow is putting upward pressure on the cost of capital. The result: a capex cycle that is likely more private-sector-led than before, where fiscal constraints reinforce, rather than crowd out, private capital formation.
Source: Dario Caldara and Matteo Iacoviello, Macrobond and Goldman Sachs Asset Management. As of July 1, 2026. Series are shown as an average across eight major geopolitical shock episodes identified using the Geopolitical Risk (GPR) index: the Korean War onset (1950 Q3), Cuban Missile Crisis (1962 Q4), Vietnam escalation (1965 Q3), Yom Kippur War/Oil Shock (1973 Q4), Iran Hostage Crisis (1979 Q4), Gulf War/Desert Storm (1990 Q3), 9/11 attacks (2001 Q3), and the Russia-Ukraine war (2022 Q1). For each episode, T+0 is the shock quarter, and each series is rebased to 100 at T-4 (four quarters before the event) to show the cumulative path from one year before to three years after the shock.
Monetary Policy: Not 2022
- Assuming the ceasefire holds and energy flows via the Strait of Hormuz resume fully over the summer, the central bank response to the Middle East crisis is likely to be more measured than the policy reaction to the energy shock that followed the Russia-Ukraine conflict. In the US, while the bar for a Fed rate hike remains high, the prospect of cuts this year has diminished materially. In the UK, we expect the BoE to hold, supported by recent softer inflation, a relatively elevated starting policy rate of 3.75%, and a weakening labor market. By contrast, following its recent 25 bps hike to 2.25%, we expect the ECB to raise rates once more in September, reflecting more persistent inflationary pressures in the euro area. Finally, after raising rates to 1.0% for the first time since 1995, we expect the BoJ to continue to normalize its monetary policy gradually, until the policy rate reaches 1.5%.
Long-Term Macro Themes
In our view, the next economic cycle will be characterized by higher inflation, elevated interest rates, and heightened macroeconomic volatility, driven by six key factors. We believe investors need to position their portfolios for CHANGE.
CHANGE
Climate transition – High level of debt – Aging demographics – New finance – Global fragmentation – Evolving technology
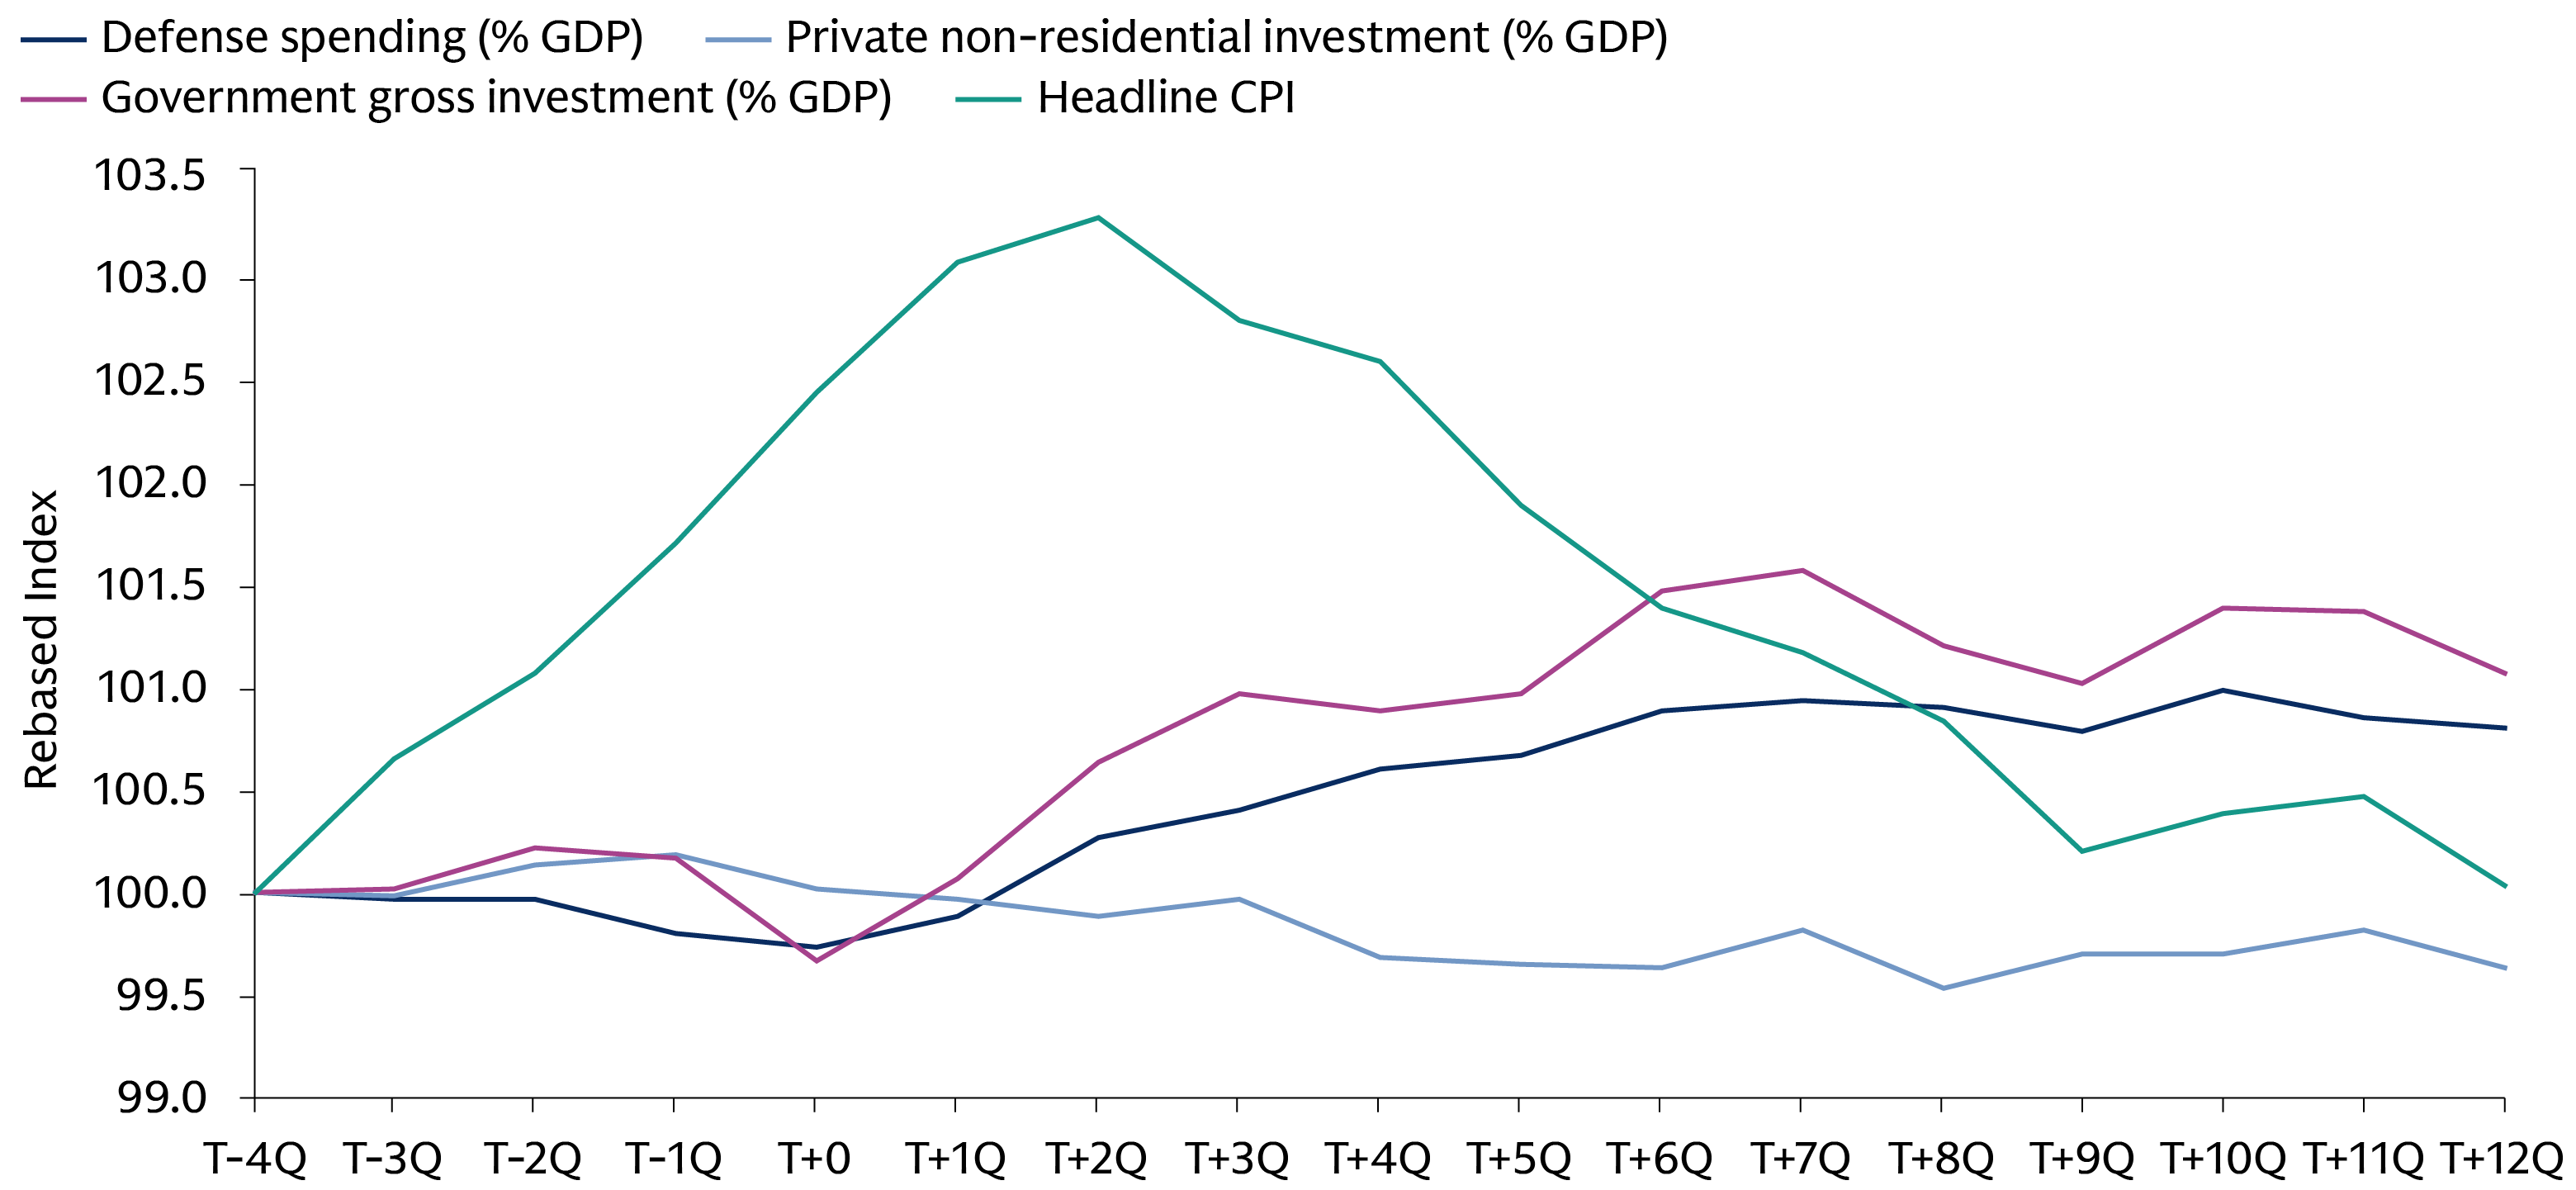
Source: World Bank, Haver, S&P, Rating Dog, Japan MAFF, MDPI, EC ARD, IEA and Goldman Sachs Asset Management. As of July 1, 2026. National & Resource Security incorporates our Q2 Market Know-How framework covering Energy, Critical Minerals, Defence Capacity and Technology & AI Leadership, supplemented with Strategic Petroleum Reserves (IEA). Trade Exposure & Supply Chain Resilience combines trade openness, import dependence, Logistics Performance Index (LPI), PMI Suppliers’ Delivery Times and PMI Stocks of Purchases (World Bank, S&P Global). Food Security combines food self-sufficiency, food CPI weights, food imports as a share of merchandise imports and agriculture value added (MAFF, MDPI, European Commission ARD, Haver Analytics, World Bank). Each indicator is converted into a relative ranking score from 0 (most vulnerable) to 1 (least vulnerable). Scores are averaged within each pillar and equally weighted across pillars to produce the overall Economic Security Score. The stacked bars show each pillar’s contribution to total economic resilience.
- Economic security is becoming an increasingly important determinant of macro resilience. Our composite framework combines national and resource security, trade and supply-chain resilience and food security. The results highlight a clear pecking order: the US and China enter this era from positions of relative strength, while Europe and Japan remain more exposed to external dependencies and geopolitical disruption.
- Resilience is no longer simply a defensive characteristic; it increasingly shapes economic outcomes. Economies with stronger resource access, larger strategic buffers, and more resilient supply chains are likely to experience shallower growth slowdowns, lower inflation pass-through, and greater policy flexibility following external shocks. By contrast, more dependent economies face greater vulnerability to supply disruptions, imported inflation, and deteriorating terms of trade.
- The same geopolitical shock is therefore unlikely to produce the same economic outcome across regions. Recent energy, trade, and supply-chain disruptions have demonstrated that countries with stronger buffers (notably the US and China) can absorb shocks and recover more quickly, while more exposed economies (such as Europe and Japan) face longer adjustment periods. We believe geopolitical fragmentation is becoming a structural source of divergence in growth, inflation, and market performance.
- In the near term, investors may continue to reward economies perceived as geopolitical safe havens. The US appears particularly well positioned given its relative strength across energy security, financial market depth, and reserve currency status.
- Longer term, however, some of the most compelling opportunities may emerge in regions currently scoring lower on resilience. Europe and Japan are already responding through industrial policy, supply-chain diversification, defence spending, energy investment, and strategic reshoring initiatives. As these adjustment cycles gather momentum, investors may find opportunities in the sectors and companies positioned to benefit from the rebuilding of economic security.
Market Themes
Our base case is a reflationary backdrop that supports risk assets, led by resilient growth and continued AI momentum, despite higher interest rates. The distribution of outcomes is unusually wide, ranging from a prolonged inflation drag on growth and multiples, to a faster-than-expected disinflation that unlocks small-cap outperformance and a fixed income rally.
Base Case Scenario
Global growth remains resilient and AI momentum continues to build, even as central banks maintain a prudent stance in the face of elevated inflation.
Key Implications
The current macro environment has the hallmarks of a reflation regime—resilient growth, persistent inflation, and accommodative fiscal policy. In this context, we remain constructive on risk assets and neutral on duration. AI investment momentum should persist, with scope for upward capex revisions that benefit US and EM equities in particular. Market gains are likely to stay earnings-led, though a more hawkish central bank stance could compress valuations, capping upside in H2 and delaying a broader rotation beyond mega-cap leadership. In fixed income, yield curves remain under pressure from both ends: cautious central banks are anchoring the front end, while loose fiscal policy and solid growth keep long-end yields elevated.
Stickier Inflation Scenario
Middle East energy-crisis spillovers prove larger than expected, driving more persistent inflation, weaker global growth and more aggressive monetary tightening.
Key Implications
Traditional hedges lose their edge as inflation stays elevated, growth slows, and rates rise, exposing portfolios to further drawdowns. In this environment, we would favor short-duration fixed income to reduce interest rate sensitivity, alongside high-dividend equities for their carry characteristics. Within risk assets, corporate credit may absorb the shock better than equities, supported by its income component. Should the monetary policy response prove global in nature, short-duration equity markets such as Europe and Japan are likely to outperform. In rates, yield curves should bear-flatten further, with front-end yields rising more than the long end as inflation risk reprices higher.
Rapid Disinflation Scenario
Geopolitical de-escalation and increased energy supply push energy prices meaningfully lower, while limited second-round inflation effects allow central banks to turn more dovish in H2 with the Fed resuming rate cuts at the end of the year.
Key Implications
Renewed dollar weakness tilts the playing field toward global ex-US equities and small caps. Core fixed income also benefits as rate pressure eases. Yield curves bull-steepen—the front-end rallies on inflation relief, but the long-end holds up, anchored by fiscal expansion and above-trend growth.
Asset Classes
Europe High-Dividend Equities
First Line of Defense
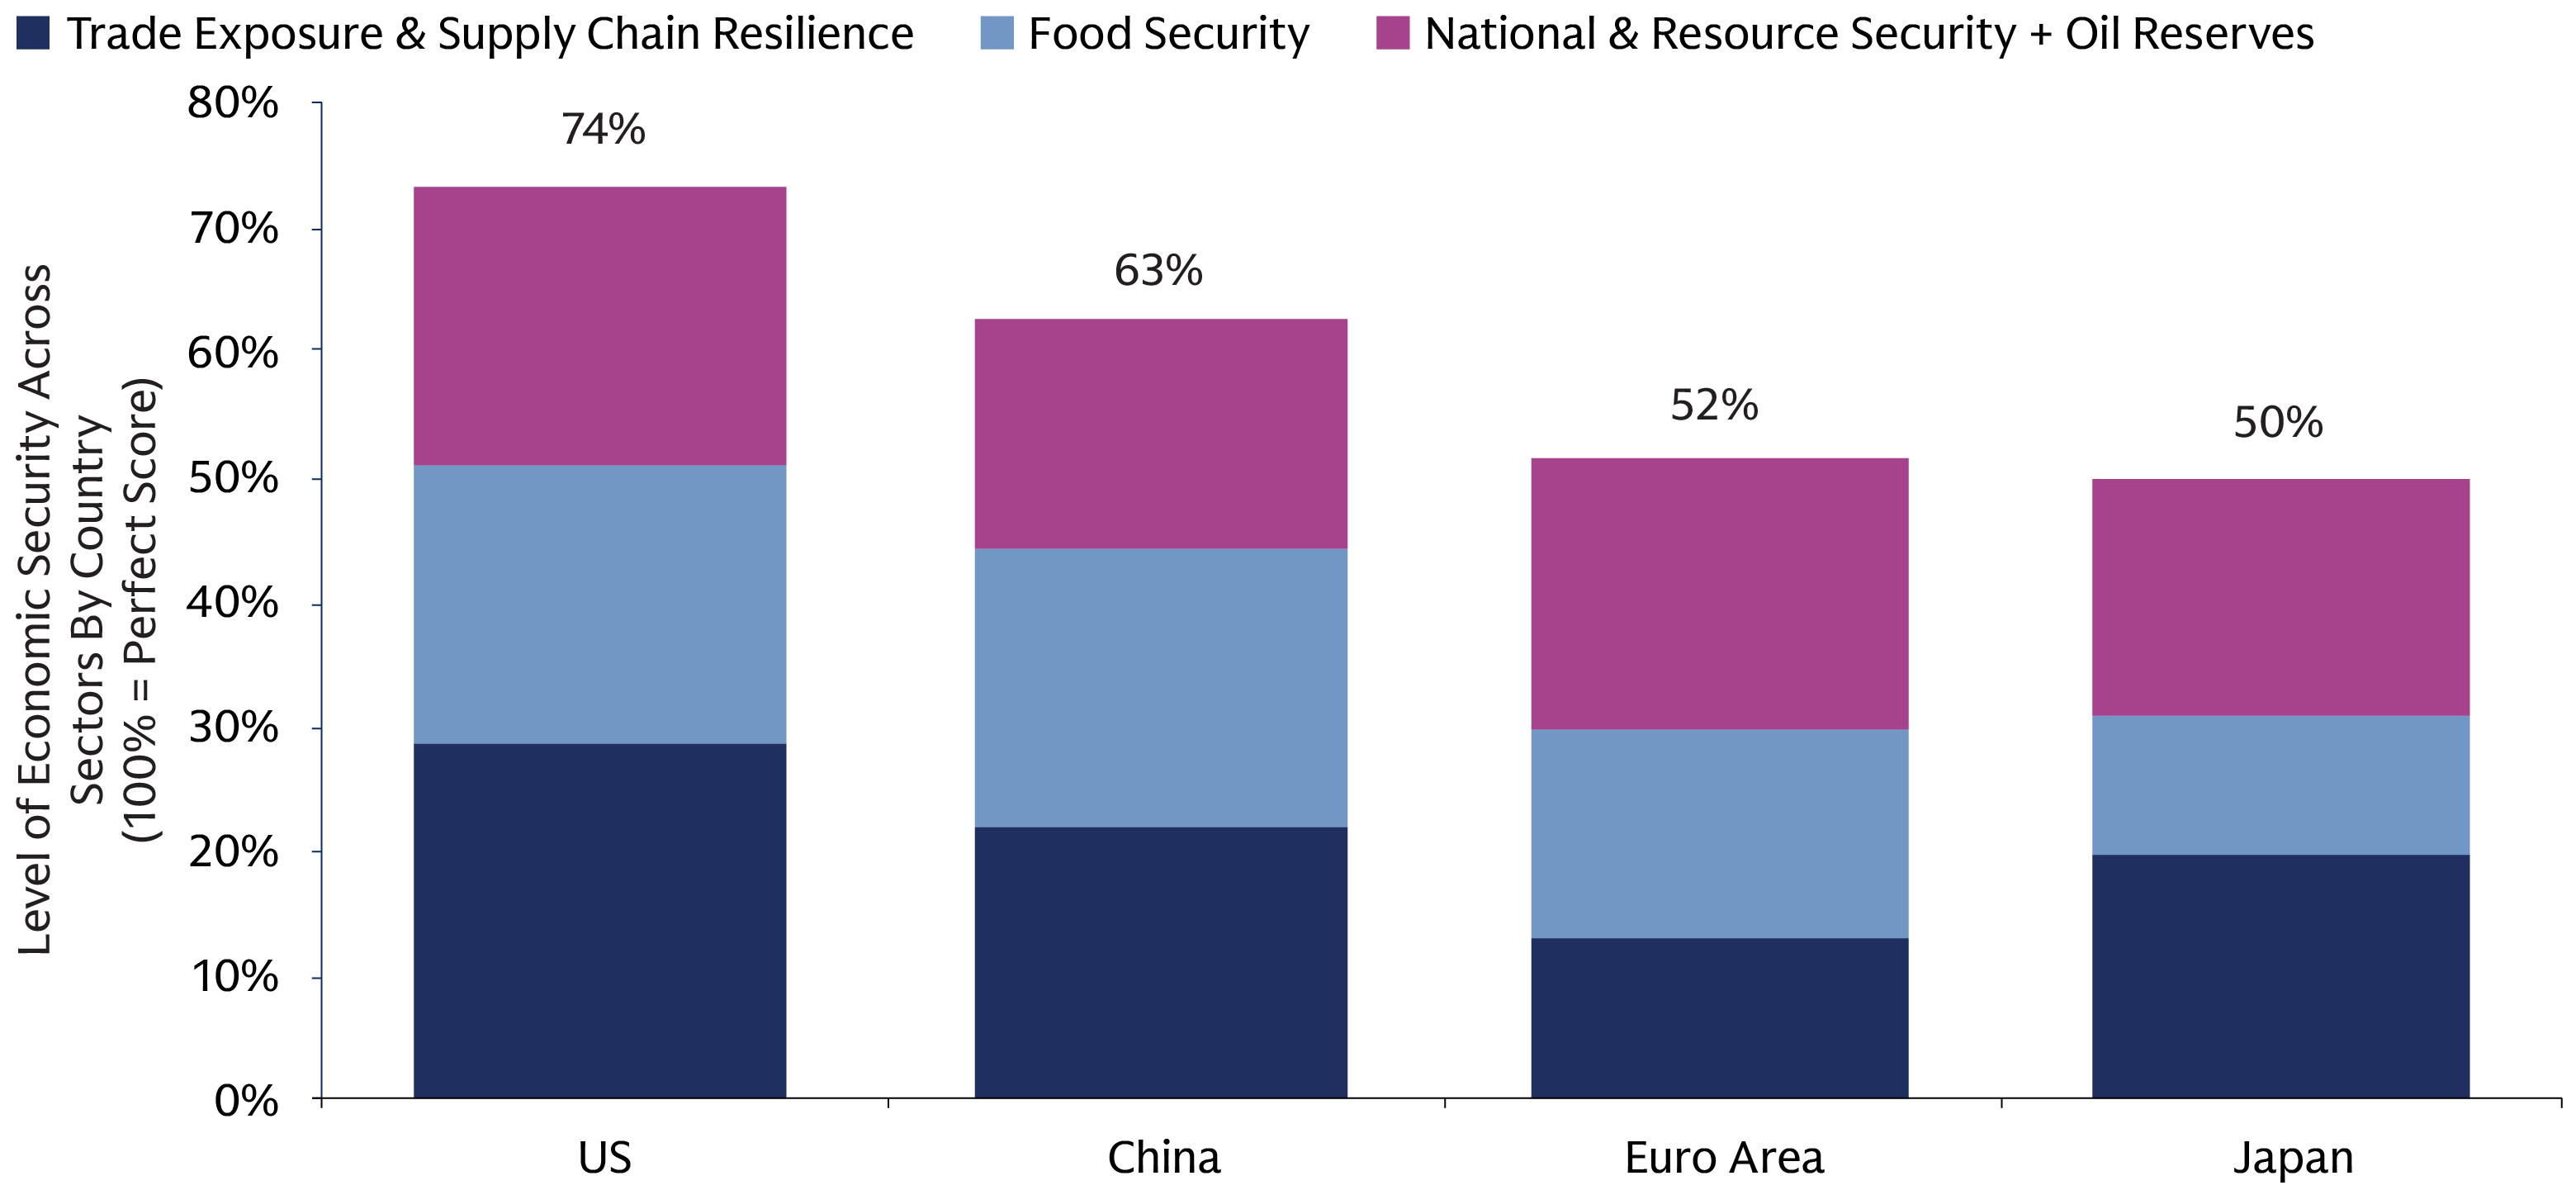
European high-dividend equities offer a short-duration, income-focused exposure built around cash-flow resilience, making them well suited to a backdrop of geopolitical uncertainty, inflation volatility and structurally higher rates. Unlike the US growth-led narrative, Europe’s opportunity is more about steady income generation and fiscal support than earnings leadership. However, capturing this requires active management to avoid value-traps and highly leveraged firms, prioritizing strong balance sheets and consistent dividend growth over absolute yield. Historically, high-dividend European equities have delivered great returns in periods of high inflation and weakening activity, reinforcing the role of income as a key driver of returns.
Source: Bloomberg, Macrobond and Goldman Sachs Asset Management. As of July 1, 2026. TR refers to total return. Europe CPI inflation is proxied by the weighted average of individual country CPI inflation rates, using the latest country weights from the MSCI Europe Index.
Global Flexible Bond
An All-Weather Solution
Geopolitical tensions are adding upside pressure on inflation while weighing on growth, creating a more uneven and shifting macro backdrop. This divergence matters for fixed income, as stagflationary and recessionary tail scenarios require very different duration positioning, with different maturities outperforming in different regimes. At the same time, elevated volatility, shifting policy expectations and widening cross-country dispersion reduce the effectiveness of static benchmark allocations. We believe unconstrained bond strategies that can actively adjust duration, sector, and/or regional exposure are well poised to navigate the current uncertainty and capture opportunities across changing market conditions.
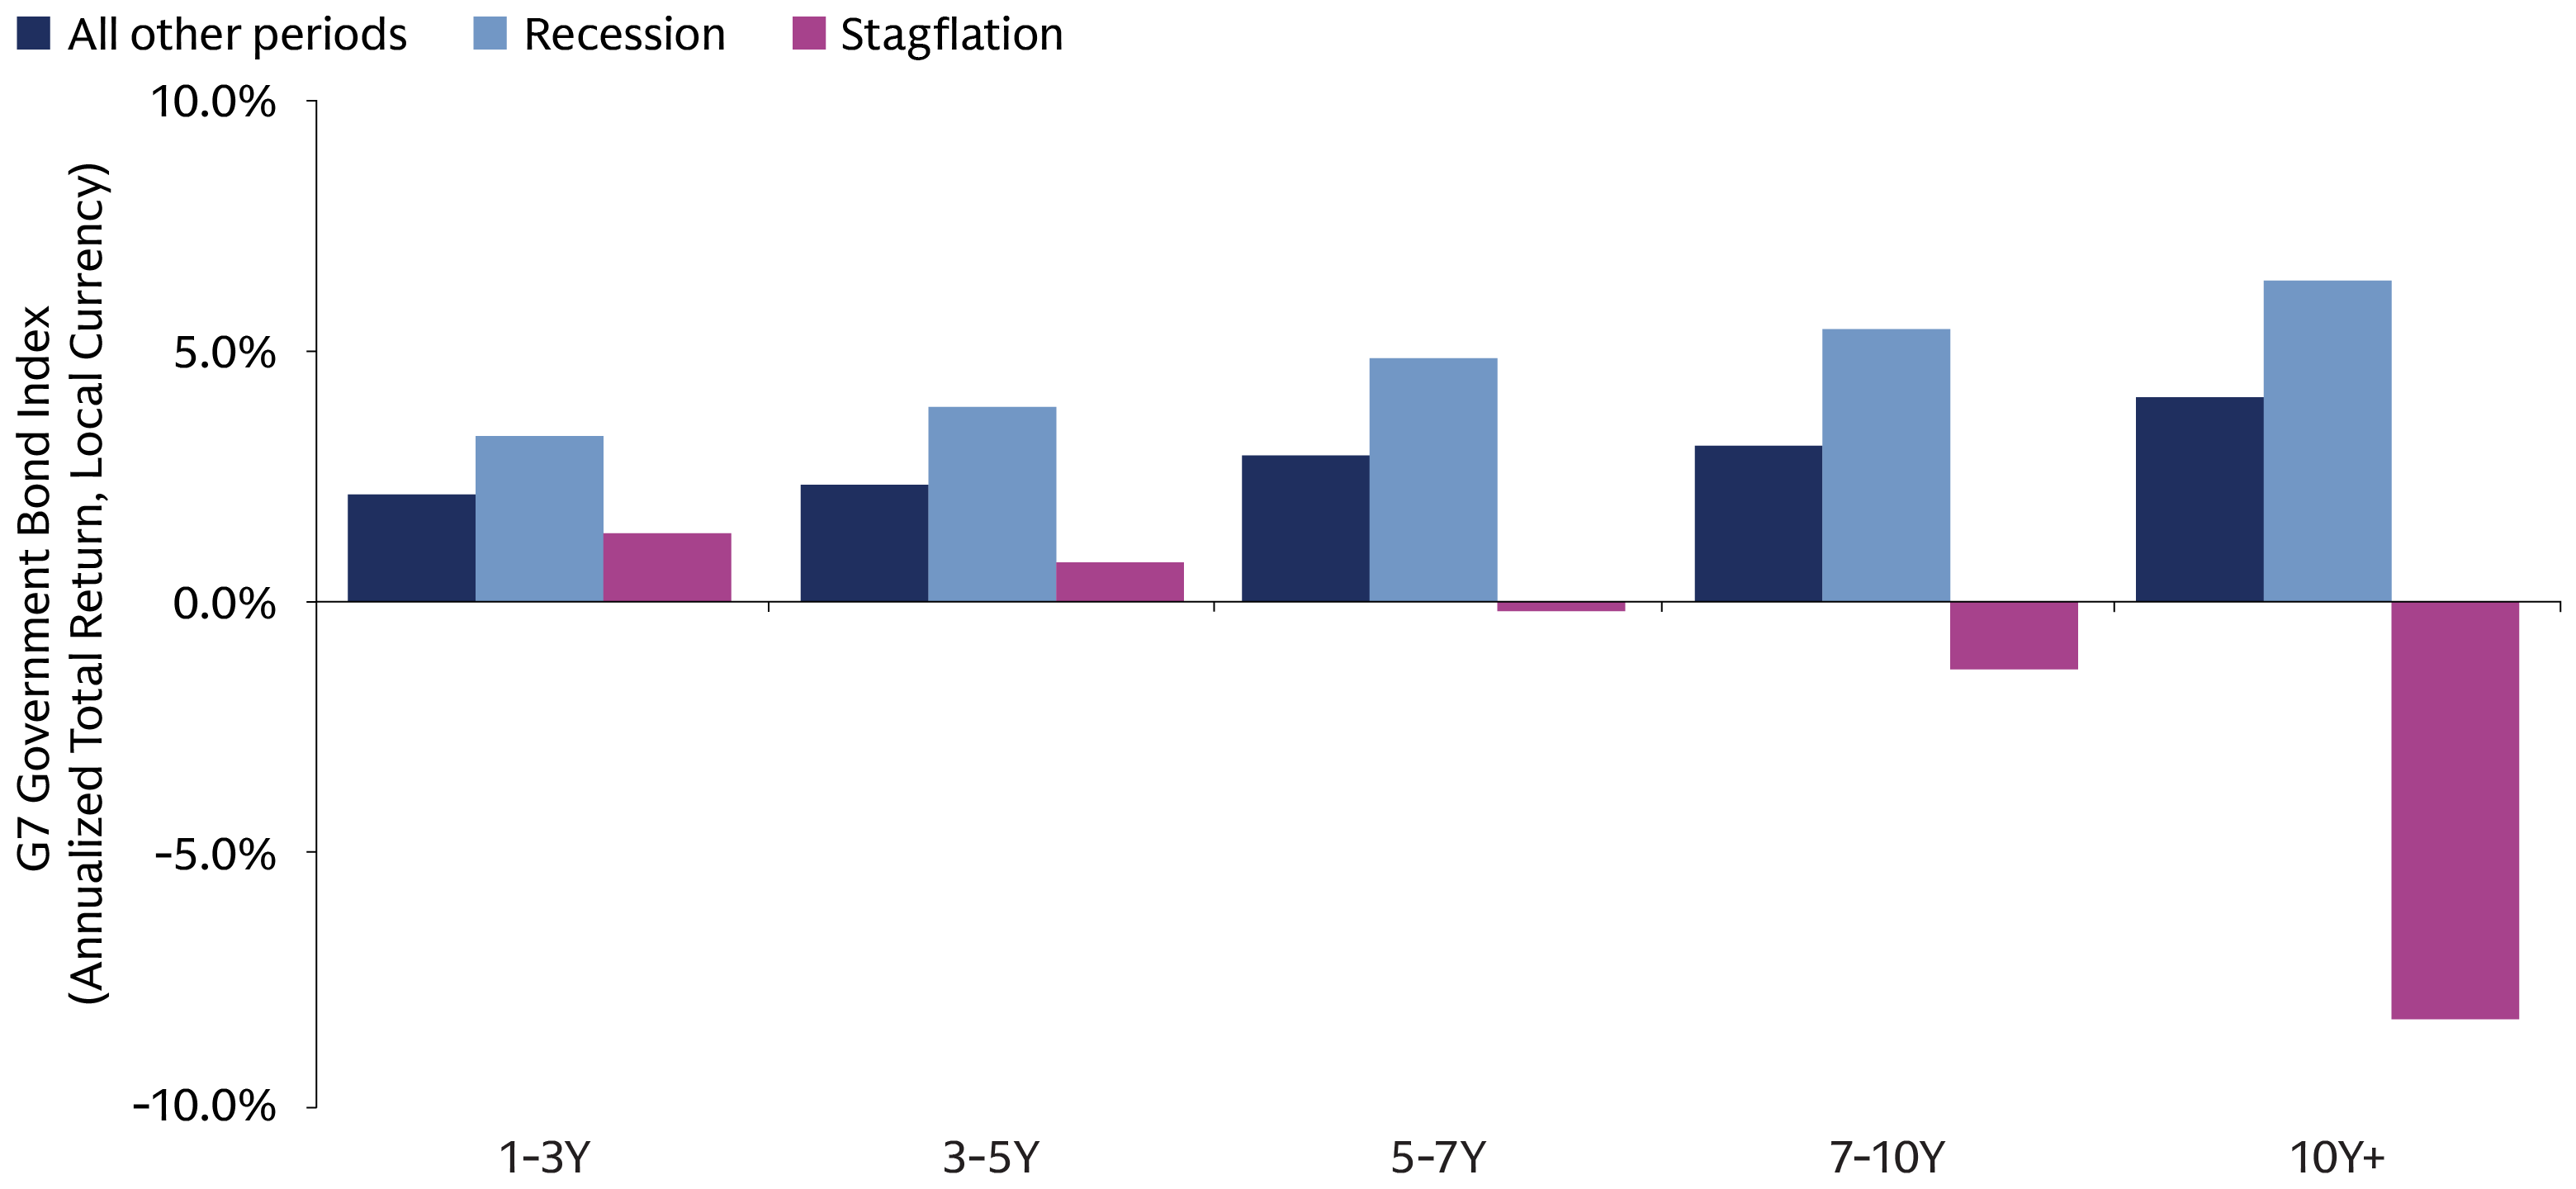
Source: Macrobond and Goldman Sachs Asset Management. As of July 1, 2026. Data is monthly and latest is May 2026.
Liquid Alternatives
Thriving In Turbulence
Traditional diversification relies on shocks remaining contained within a single asset class. Liquid alternatives have historically been most valuable when that assumption breaks down. Across trend-following, market neutral and multi-strategy approaches, excess returns were strongest when both equity and bond market volatility were elevated simultaneously. This points to a different role for liquid alternatives within portfolios: not simply as diversifiers of assets, but as diversifiers of market regimes. As geopolitical uncertainty, inflation shocks and policy transitions increasingly spill across asset classes, strategies with the flexibility to adapt across changing market environments may become a more important source of portfolio resilience.
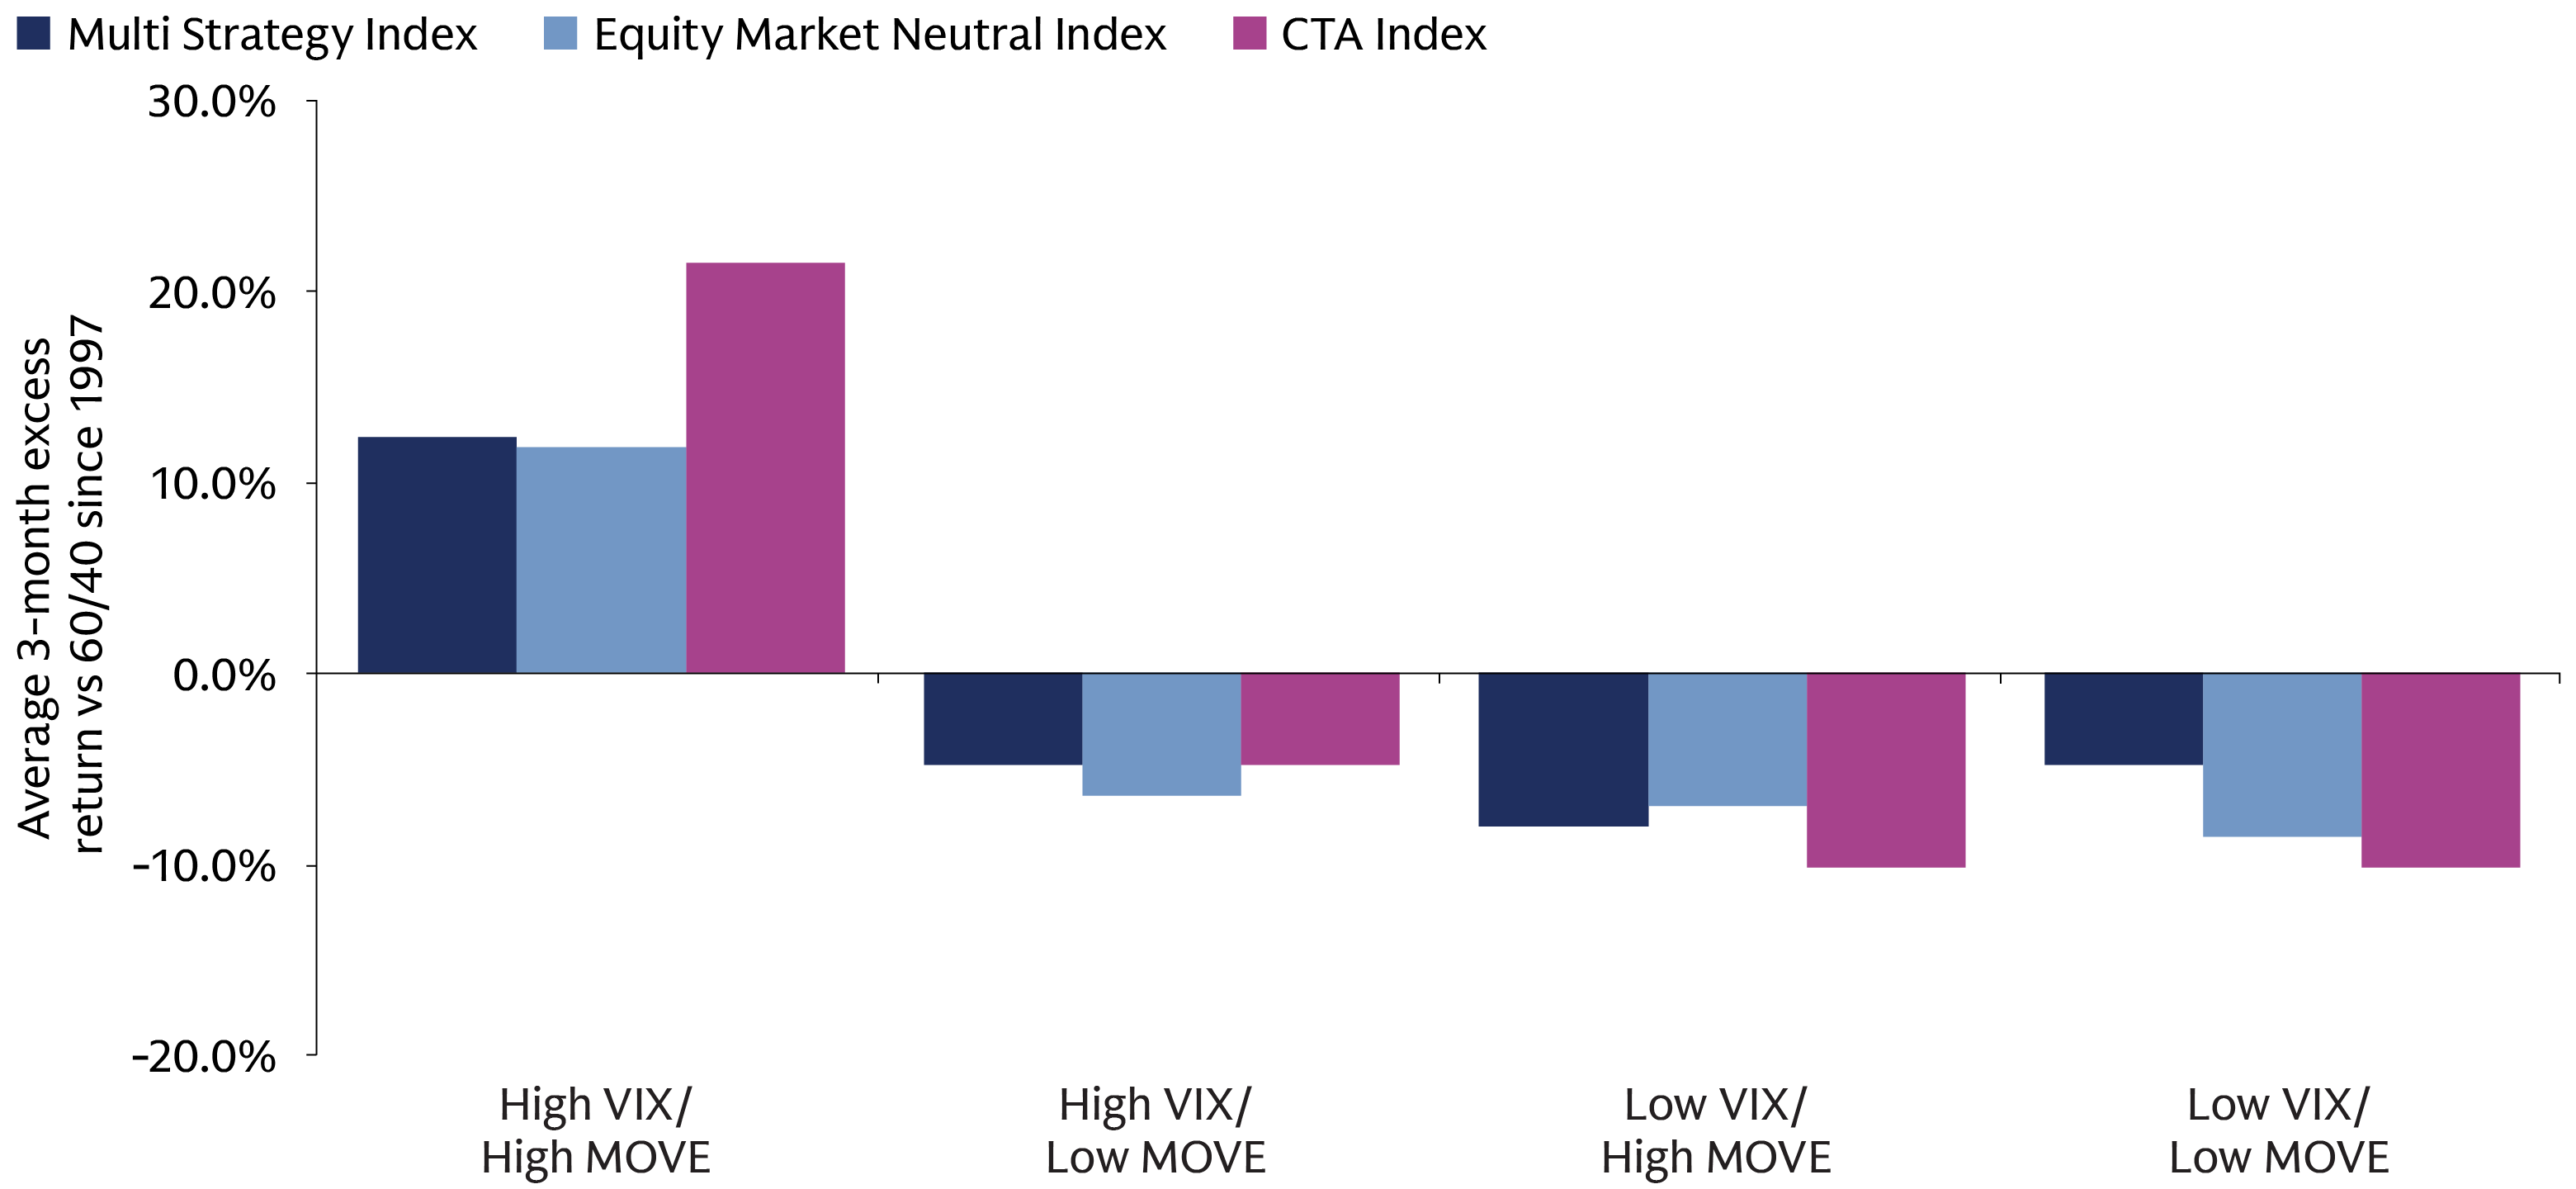
Source: Macrobond and Goldman Sachs Asset Management. As of July 1, 2026. Monthly data since January 1997 were sourced from Macrobond. Liquid alternative strategies are represented by the Barclay Hedge CTA, Multi-Strategy and Equity Market Neutral total return indices, while the benchmark 60/40 portfolio consists of 60% S&P 500 Total Return Index and 40% JPMorgan CMI Traded 10-Year Total Return Index. Market regimes are defined using monthly VIX and MOVE observations, with low regimes below the 50th percentile and high regimes above the 75th percentile of their historical distributions. The chart shows the annualized average three-month excess return of each liquid alternative strategy relative to the 60/40 portfolio across the four volatility regimes.
1 Goldman Sachs Global Investment Research, Oil Analyst: “Weaker Demand Offsets a Longer Hormuz Disruption”, 11 June 2026.
2 Goldman Sachs Global Investment Research, Oil Analyst: “Reducing Our Price Forecast on Deal to Reopen Hormuz”, 15 June 2026.
3 IEA as of May 2026: https://www.iea.org/reports/oil-market-report-march-2026.