Hedge Funds: Improved Prospects in the Post-Modern Cycle?
The Times They Are A-Changin’
From the 1980s a ‘Modern Cycle’ evolved driven by low inflation and interest rates, independent central banks, globalization, innovation, and generally lower volatility. These tailwinds—in concert with the Federal Reserve’s Zero Interest Rate Policy (ZIRP) intended to speed recovery from the Global Financial Crisis (GFC)—helped fuel a 16% annualized return for the S&P 500 since its March 2009 low, and an 11% return for a classic 60/40 illustrative portfolio. Both delivered returns well above long-term historical trend in this extraordinary period. Interestingly, the global aggregate hedge fund universe—considering the HFRI Fund Weighted Composite Index (HFRI) as proxy—well underperformed (see exhibit below), albeit with more muted volatility.1
However, we suspect we have now entered a ‘Post-Modern Cycle’ shaped by increased geopolitical risk, a partial pullback from globalization, and higher energy and labor costs. This environment has the potential to result in stickier inflation, a higher-for-longer rate environment, and elevated volatility for risk assets overall. This different set of macro conditions and priorities may imply different opportunities and risks for investors to consider, and the above-average equity and bond returns they have become accustomed to may potentially be challenged.
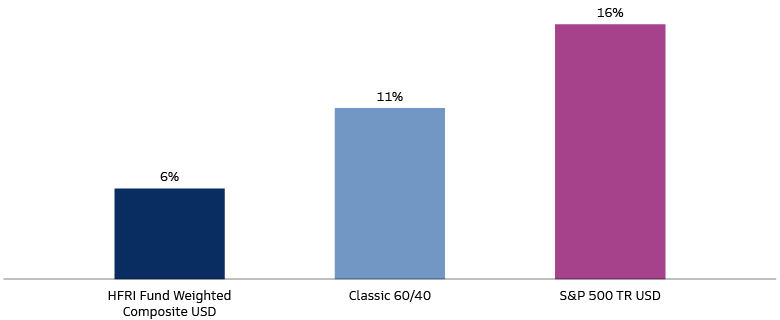
Source: Morningstar Direct. As of March 31, 2023. HFRI Fund Weighted Composite Index, a global, equal-weighted index of single-manager funds that report to HFR Database. HFR Database © HFR, Inc. 2023, www.hedgefundresearch.com. Past performance does not predict future returns. Constituent funds report monthly net of all fees performance in US Dollar and have a minimum of $50 Million under management or $10 Million under management and a twelve (12) month track record of active performance. “60/40” = 60% S&P 500 TR USD Index + 40% Bloomberg US Aggregate Bond TR USD Index. The performance results are based on historical performance of the indices used. The result will vary based on market conditions and your allocation. Past performance does not guarantee future results, which may vary.
Improved Prospects for Hedge Funds in the Post-Modern Cycle
We think a more challenging macroeconomic backdrop bodes well for the relative performance of hedge funds. Since inception in January 1990, the HFRI Index has tended to outperform equities and a more conservative 60/40 illustrative portfolio across high equity volatility regimes (as measured by the VIX Index), elevated inflation periods, and non-ZIRP periods (see exhibits below).
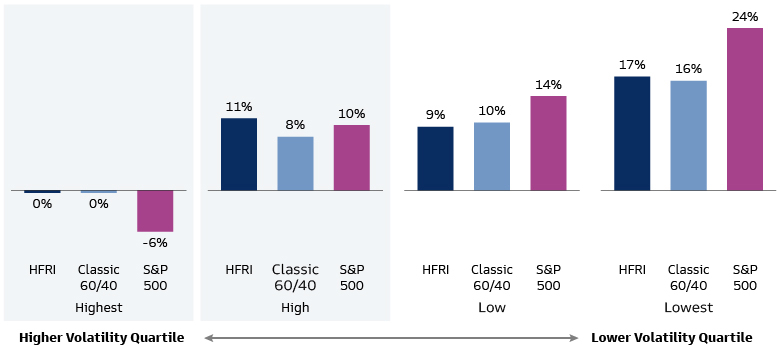
Source: Monthly Returns from Morningstar Direct, since HFRI Fund Weighted Composite Index inception January 1990-March 2023. As of March 2023. VIX Daily Closing Price from Bloomberg. Volatility is measured by standard deviation. The performance results are based on historical performance of the indices used. The result will vary based on market conditions and your allocation. Past performance does not guarantee future results, which may vary.
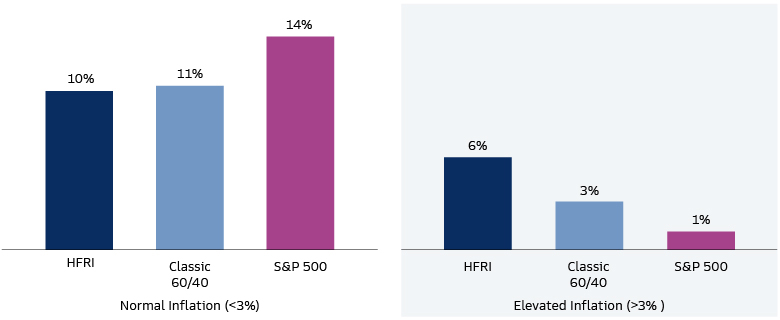
Source: Monthly Returns from Morningstar Direct, since HFRI Fund Weighted Composite Index inception January 1990-March 2023. As of March 2023. 12-Mo Percent Change in CPI from US BLS. The performance results are based on historical performance of the indices used. The result will vary based on market conditions and your allocation. Past performance does not guarantee future results, which may vary.
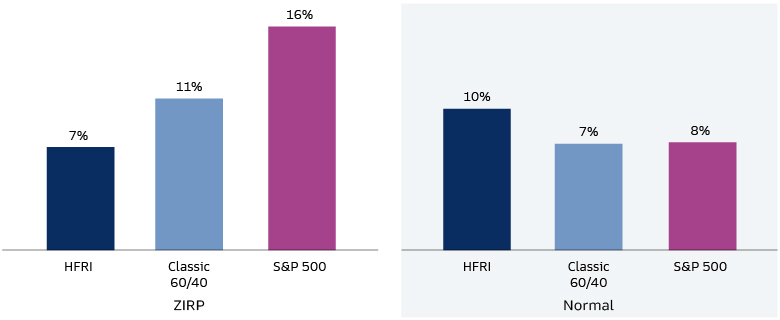
Source: Monthly Returns from Morningstar Direct, since HFRI Fund Weighted Composite Index inception January 1990-March 2023. As of March 2023. Monthly Effective Fed Funds Rate from St. Louis Fed. “ZIRP” = Zero Interest Rate Policy, defined as a period when the effective Federal Funds Rate < 50 bps. The performance results are based on historical performance of the indices used. The result will vary based on market conditions and your allocation. Past performance does not guarantee future results, which may vary.
Diversification in Action
The primary function of a liquid alternative should be to smooth overall portfolio volatility and improve risk-adjusted returns and investor experience, by extension. We believe hedge funds can fill this role. The HFRI Index—with its constituent Equity Long/Short, Macro, Trend-Following, Relative Value, Event Driven strategies—has historically provided a diversifying pattern of returns, particularly during times of equity or fixed income market stress.
Since inception of the HFRI, an illustrative 60/40 portfolio with a modest 15% allocation to hedge funds has been more likely to deliver higher risk-adjusted returns relative to a classic 60/40 illustrative portfolio over reasonable investment horizons. This frequent occurrence of outperformance was handicapped by the inclusion of the post-GFC period of benign macro conditions and exuberant returns—outside of 2022 (see exhibit 5).
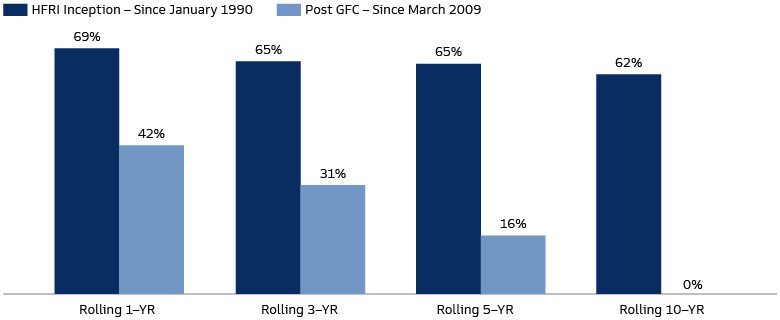
Source: Morningstar Direct. As of March 31, 2023. January 1990: January 1, 1990. March 2009: March 1, 2009. The performance results are based on historical performance of the indices used. The result will vary based on market conditions and your allocation. Past performance does not guarantee future results, which may vary.
The tide may already be turning. Over the last three years—across dramatic market terrain—a 60/40 portfolio that included hedge funds would have delivered modestly better absolute performance (9.9% annualized versus 9.6% for a classic 60/40 portfolio), but with more muted volatility (12.0% annualized versus 13.1%). It captured less downside than the classic portfolio, with a lower maximum drawdown in 2022. We believe the Post-Modern Cycle we foresee has strong potential to reinforce this added value of hedge fund portfolio integration in the long term.
1 Global aggregate hedge fund universe, as represented by the HFRI Fund Weighted Composite Index, a global, equal-weighted index of single-manager funds that report to HFR Database. Goldman Sachs Asset Management as of March 31, 2023.
