How Green Bonds Can Strengthen Fixed Income Portfolio Diversification

For years, investors have been adding green bonds to their fixed income portfolios to help achieve their sustainable-investing goals. Green bonds have financial characteristics similar to those of conventional bonds. As a result, allocating to green bonds allows investors to increase their exposure to climate and environmental themes without impacting their portfolios’ risk-return profile. Yet allocating to green bonds can also contribute to another benefit: portfolio diversification.
This diversification potential derives primarily from two key differences between the green bond market and the overall bond market, in our view. The first is sector composition. Treasuries and industrial companies account for a comparatively smaller share of the green bond market, while financial firms and utilities are more prevalent.1 The second source of diversification is currency composition: the global green bond market is dominated by the euro, while the US dollar ranks first in the overall bond market.2
To understand the implications of these differences for portfolio construction, we analyzed how adding a standalone green bond allocation to a conventional fixed income portfolio affects diversification. Our goal was to determine the green bond percentage that delivers the optimal diversification impact.
Measuring the Diversification Benefits of Green Bonds
We began by selecting bond indices to represent a conventional broad-based fixed income portfolio and a standalone green bond allocation. We believe that increasing green bond exposure within a portfolio benchmarked to an aggregate fixed income index would not enable optimal diversification because most investors would still largely replicate the conventional index. By contrast, a standalone green bond allocation has the potential to boost diversification of the overall portfolio without causing significant tracking-error deviations because the green bond portion is managed against a relevant green bond index.
For our analysis at the global level, we chose the Bloomberg Global Aggregate Index and the Bloomberg MSCI Global Green Bond Index, both of which are often used as portfolio benchmarks.3 To study diversification in a corporate bond portfolio, we used the Bloomberg Global Aggregate Corporate Index and the Bloomberg MSCI Global Green Bond Index: Corporate.4
For each index, we looked first at the sectoral composition using the Bloomberg Fixed Income Classification System (Class 2), which divides issuers into 12 types, including treasury, agency, financial institutions and supranational.5 In our analysis of the corporate bond market, we used the three most pertinent categories: financials, industrial companies and utilities.
The aggregate index was our starting point in each case. To assess its diversification, we applied the Herfindahl-Hirschman Index (HHI), a common method for measuring market concentration.6 We then replaced portions of the index with green bonds, moving in 5% increments, and measured the HHI at each step up to 100% replacement. Our analysis was conducted at a specific point in time, using data as of June 30, 2025, and does not have historical implications.
We then repeated this process using the index weightings of the main currencies of denomination. The HHI scale approaches zero in a highly competitive market, which in our analysis translates to a highly diversified bond portfolio. The scale approaches one, its maximum level, when a market is dominated by a single company – or for our purposes, when a portfolio is dominated by one issuer type or currency of denomination.7
Optimizing Diversification With a Standalone Green Bond Allocation
The green bond market is expanding rapidly, reaching $2.9 trillion midway through 2025,8 driven by strong investor demand and a broadening range of issuers. As it grows, the green bond market increasingly resembles the wider market in some important aspects, such as duration,9 but important structural differences remain.
In our analysis, we looked at the combined diversification impact of two key areas of divergence, starting with sectoral composition. Replacing conventional bonds in the aggregate index with green bonds consistently improves sector diversification all the way to 100% replacement.10 This highlights the sectoral diversification of the green bond index, which results primarily from its lower exposure to treasuries – about a quarter of the index, compared with about half of the global aggregate index.
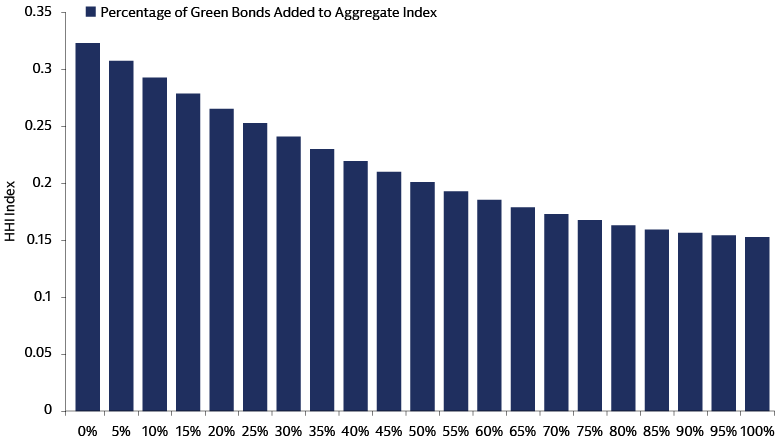
Source: Bloomberg, Goldman Sachs Asset Management. As of June 30, 2025.
When it comes to currency diversification, we found that replacing 20% of the aggregate index with green bonds delivered the greatest benefit. At this level, the aggregate index’s exposure to the US dollar was trimmed by the addition of green bonds. Beyond this level, however, the concentration of the index began to increase because of the dominance of the euro in the green bond index.
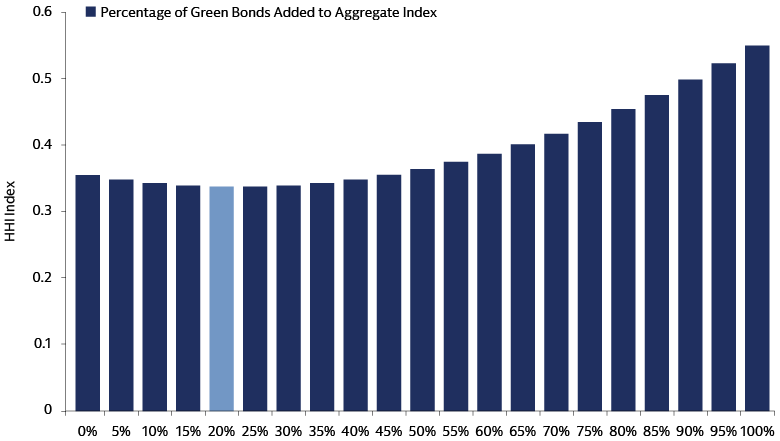
Source: Bloomberg, Goldman Sachs Asset Management. As of June 30, 2025.
We concluded that 20% is the optimal global green bond allocation because it provides diversification benefits across both sector and currency without causing excessive tracking error. At this level, sectoral weightings occupy a middle ground between the aggregate and green bond indices.
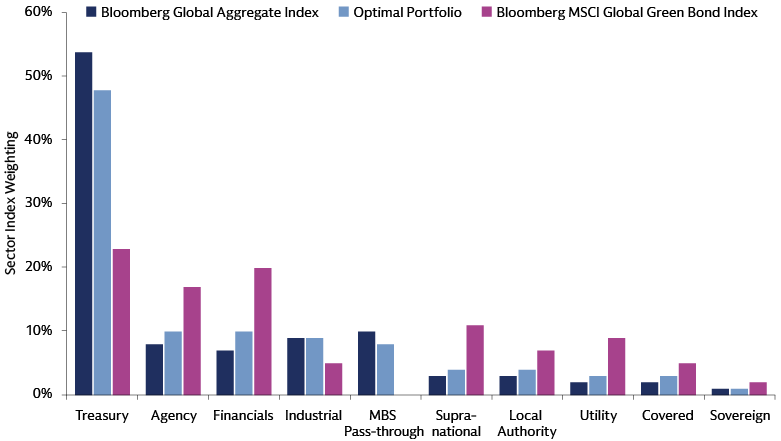
Source: Bloomberg, Goldman Sachs Asset Management. As of June 30, 2025.
A 20% standalone green bond allocation also has a limited or negligible impact on other key factors – duration, spread, yield and total return.
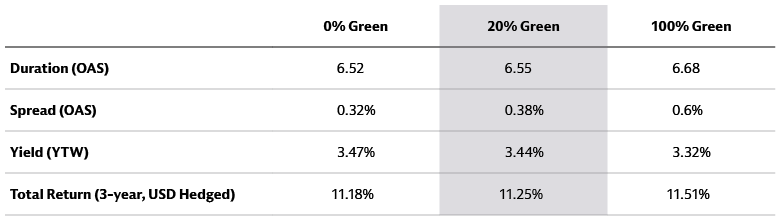
Source: Bloomberg, Goldman Sachs Asset Management. As of June 30, 2025. OAS refers to “option-adjusted spread.” YTW stands for “yield to worst.”
Analyzing Opportunities to Diversify a Corporate Bond Portfolio
The addition of green bonds can also improve sectoral and currency diversification in corporate bond portfolios. While the main sectors of issuance are the same in the green bond and aggregate corporate indices, their weightings are quite different. In the green bond index used in our analysis, financials are by far the largest sector at 58%, followed by utilities at 27% and industrial companies at 15%. In the aggregate index, by contrast, industrials are the largest category with an index weight of 52%. Financials are second at 39% and utilities third at 9%.
Adding green bonds in 5% increments to the aggregate corporate bond index, and calculating HHI at each step, we found that the optimum sector diversification was achieved at 50% green bonds.
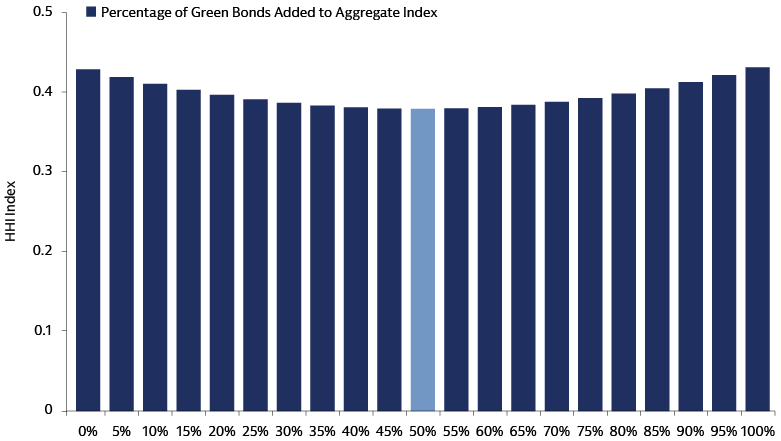
Source: Bloomberg, Goldman Sachs Asset Management. As of June 30, 2025.
Currency composition also differs markedly between the two corporate bond indices. In the green bond index, euro-denominated securities account for 69% of the market, with the US dollar a distant second at 23%. The aggregate index is dominated by US dollar-denominated securities, which account for 66% of the index. The euro is second at 25%. Adding green bonds to the aggregate index yielded optimal currency diversification at 45% green bonds.
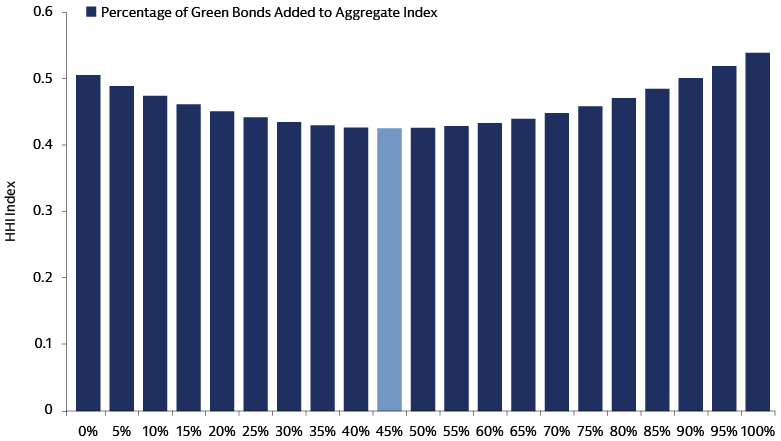
Source: Bloomberg, Goldman Sachs Asset Management. As of June 30, 2025.
When looking at the diversification benefits of adding green bonds to a corporate fixed income portfolio, our analysis showed that 45% is the optimal level across sectoral and currency composition. An allocation at this level has a limited or negligible impact on duration, spread, yield and total return.
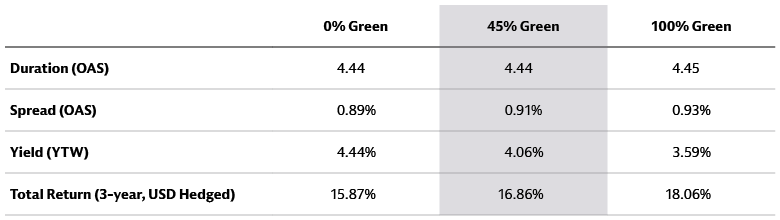
Source: Bloomberg, Goldman Sachs Asset Management. As of June 30, 2025.
Green Bonds Can Help Strengthen Fixed Income Portfolio Resilience
The 2020s, from the pandemic through this year’s heightened market volatility, have taught investors to expect the unexpected. Ongoing fiscal risks, policy shifts and geopolitical uncertainty underscore the importance of a diversified investment strategy, in our view. For fixed income investors, we believe an allocation to green bonds can help provide significant portfolio diversification without sacrificing liquidity or returns. Investors can benefit from an allocation to green bonds from a traditional risk management perspective as well as by increasing sustainability exposure. While we believe the green bond market will continue to grow and diversify in the years ahead, we think some differences with the conventional fixed income market will remain, for example in terms of sector composition. As a result, we believe that adding a standalone green bond allocation will continue to provide portfolio-diversification benefits for investors.
1Bloomberg, Goldman Sachs Asset Management. As of June 30, 2025. In this analysis, we use two indices as global market proxies: the Bloomberg MSCI Global Green Bond Index and Bloomberg Global Aggregate Index. Treasuries account for 23% of the green bond index, financials for 20%, utilities 9% and industrials 5%. By contrast, the aggregate index is 54% treasuries, 7% financials, 2% utilities and 9% industrials.
2Bloomberg, Goldman Sachs Asset Management. As of June 30, 2025. In the Bloomberg MSCI Global Green Bond Index, euro-denominated securities account for 71% of the index, with the US dollar a distant second at 14%. By contrast, the US dollar ranks first in the Bloomberg Global Aggregate Index with a 44% share, followed by the euro at 23%.
3The Bloomberg Global Aggregate Index is “a flagship measure of global investment-grade debt from 28 local currency markets. This multi-currency benchmark includes treasury, government-related, corporate and securitized fixed-rate bonds from both developed and emerging markets issuers.” See “Bloomberg Fixed Income Indices Fact Sheets & Publications,” Bloomberg Professional Services website. As of December 15, 2023.
The Bloomberg MSCI Global Green Bond Index is a multi-currency benchmark that includes local currency debt markets tracked by the Bloomberg Global Aggregate Index. See “Bloomberg MSCI Green Bond Indices,” MSCI and Bloomberg. As of September 7, 2021.
4The Bloomberg Global Aggregate Corporate Index is “a flagship measure of global investment grade, fixed-rate corporate debt. This multi-currency benchmark includes bonds from developed and emerging markets issuers within the industrial, utility and financial sectors.” See “Bloomberg Fixed Income Indices,” Bloomberg. As of August 24, 2021.
The Bloomberg MSCI Global Green Bond Index: Corporate “aims to track fixed-income securities in which the proceeds will be exclusively and formally applied to projects or activities that promote climate or other environmental sustainability purposes through their use of proceeds (Green Bonds).” See “Bloomberg MSCI ESG Fixed Income Indices,” MSCI and Bloomberg. As of September 19, 2023.
5“Bloomberg Fixed Income Index Methodology,” Bloomberg Professional Services. As of July 21, 2025. Bloomberg defines the treasury category as “native-currency debt issued by central governments” that is “backed by the full faith and credit of a central government.” The agency category captures “all issuers that are owned, sponsored or whose payments are guaranteed by a government.”
6The HHI is calculated by squaring the market share of each company in a market and adding up the resulting numbers.
7The HHI scale ranges from 0 to 1 when market shares are expressed as fractions or percentage points. If whole percentages are used, the index ranges from 0 to 10,000 points. Thus, an index of .25 is equivalent to 2,500 points.
8Bloomberg. As of June 30, 2025.
9Bloomberg, Goldman Sachs Asset Management. As of August 13, 2025.
10A small portion – 2.2% – of the securities in the green bond index are also present in the aggregate index. Source: Bloomberg, Goldman Sachs Asset Management. As of August 13, 2025.
