
Chart of the Week: Attractive Asymmetry
The sharp rise in interest rates across the curve has raised questions about how investors should manage their fixed income exposure. Higher starting yields now provide a substantial cushion, particularly at the long end, where the potential gains from a 50 bp decline in rates exceed losses from a 50 bp rate increase by as much as ~14pp. Although rate relief may be limited without meaningful disinflationary progress, elevated yields have created a favorable return asymmetry that may present a compelling opportunity for longer-term investors.
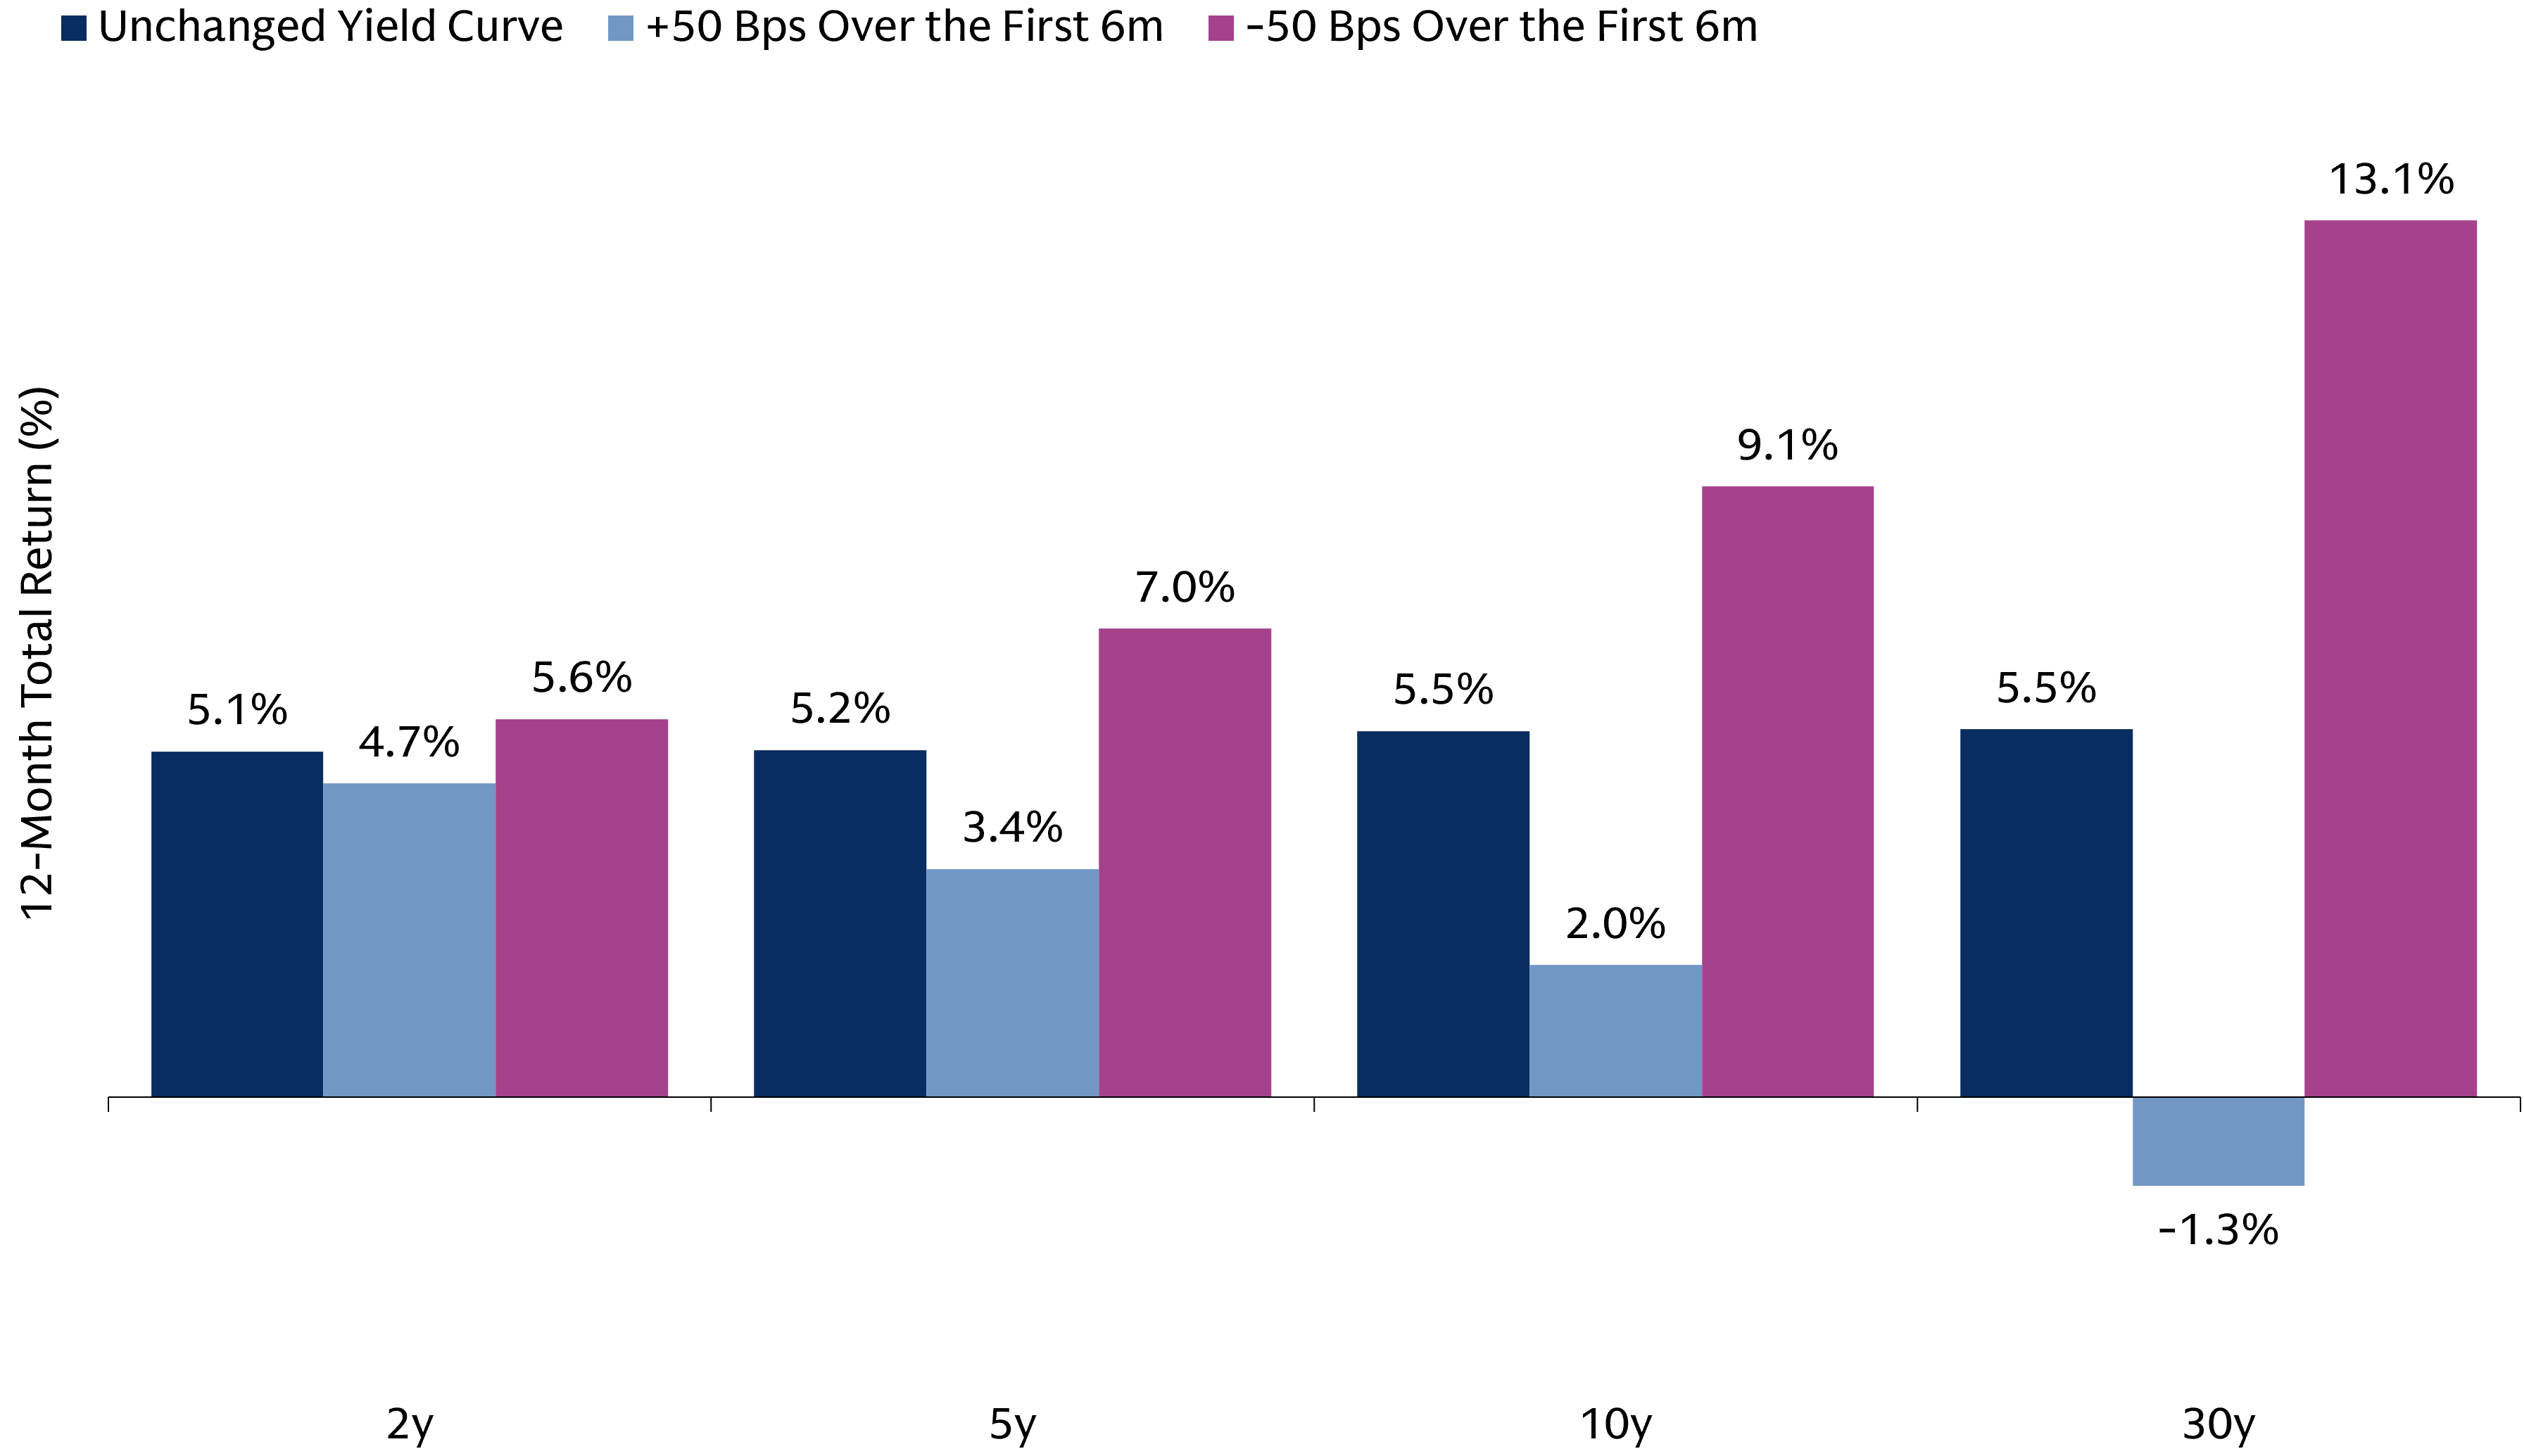
Source: Bloomberg and Goldman Sachs Asset Management. As of October 14, 2026. Chart shows the 1-year total return for US Treasury bonds of different maturities if the yield curve remains unchanged, if it shifts higher by 50 bps over the first 6 months, or if it shifts lower 50 bps over that time frame. “Bp” refers to basis points. “pp” refers to percentage points. Chart assumes bonds are bought at par and held over a year, with coupons reinvested at the 6-month rate. Past performance does not predict future returns and does not guarantee future results, which may vary. ‘We’ refers to Goldman Sachs Asset Management. For Illustrative Purposes Only. Please see additional disclosures at the end of this presentation.
Download the full document, which includes the chart of the week and insights on market developments. On pages 3 and 4, we further recap equity sector, size and style returns, global index returns, as well as rates and spread movements and a monthly snapshot of global equity valuations.

Equity investments are subject to market risk, which means that the value of the securities in which it invests may go up or down in response to the prospects of individual companies, particular sectors and/or general economic conditions. Different investment styles (e.g., “growth” and “value”) tend to shift in and out of favor, and, at times, the strategy may underperform other strategies that invest in similar asset classes. The market capitalization of a company may also involve greater risks (e.g. "small" or "mid" cap companies) than those associated with larger, more established companies and may be subject to more abrupt or erratic price movements, in addition to lower liquidity.
Investments in fixed income securities are subject to the risks associated with debt securities generally, including credit, liquidity, interest rate, prepayment and extension risk. Bond prices fluctuate inversely to changes in interest rates. Therefore, a general rise in interest rates can result in the decline in the bond’s price. The value of securities with variable and floating interest rates are generally less sensitive to interest rate changes than securities with fixed interest rates. Variable and floating rate securities may decline in value if interest rates do not move as expected. Conversely, variable and floating rate securities will not generally rise in value if market interest rates decline. Credit risk is the risk that an issuer will default on payments of interest and principal. Credit risk is higher when investing in high yield bonds, also known as junk bonds. Prepayment risk is the risk that the issuer of a security may pay off principal more quickly than originally anticipated. Extension risk is the risk that the issuer of a security may pay off principal more slowly than originally anticipated. All fixed income investments may be worth less than their original cost upon redemption or maturity.
International securities may be more volatile and less liquid and are subject to the risks of adverse economic or political developments. International securities are subject to greater risk of loss as a result of, but not limited to, the following: inadequate regulations, volatile securities markets, adverse exchange rates, and social, political, military, regulatory, economic or environmental developments, or natural disasters.
Emerging markets investments may be less liquid and are subject to greater risk than developed market investments as a result of, but not limited to, the following: inadequate regulations, volatile securities markets, adverse exchange rates, and social, political, military, regulatory, economic or environmental developments, or natural disasters.
References to indices, benchmarks or other measures of relative market performance over a specified period of time are provided for your information only and do not imply that the portfolio will achieve similar results. The index composition may not reflect the manner in which a portfolio is constructed. While an adviser seeks to design a portfolio which reflects appropriate risk and return features, portfolio characteristics may deviate from those of the benchmark.
Economic and market forecasts presented herein reflect a series of assumptions and judgments as of the date of this presentation and are subject to change without notice. These forecasts do not take into account the specific investment objectives, restrictions, tax and financial situation or other needs of any specific client. Actual data will vary and may not be reflected here. These forecasts are subject to high levels of uncertainty that may affect actual performance. Accordingly, these forecasts should be viewed as merely representative of a broad range of possible outcomes. These forecasts are estimated, based on assumptions, and are subject to significant revision and may change materially as economic and market conditions change. Goldman Sachs has no obligation to provide updates or changes to these forecasts. Case studies and examples are for illustrative purposes only.
THIS MATERIAL DOES NOT CONSTITUTE AN OFFER OR SOLICITATION IN ANY JURISDICTION WHERE OR TO ANY PERSON TO WHOM IT WOULD BE UNAUTHORIZED OR UNLAWFUL TO DO SO.
Prospective investors should inform themselves as to any applicable legal requirements and taxation and exchange control regulations in the countries of their citizenship, residence or domicile which might be relevant.
This material is provided for informational purposes only and should not be construed as investment advice or an offer or solicitation to buy or sell securities. This material is not intended to be used as a general guide to investing, or as a source of any specific investment recommendations, and makes no implied or express recommendations concerning the manner in which any client’s account should or would be handled, as appropriate investment strategies depend upon the client’s investment objectives.
Past performance does not guarantee future results, which may vary. The value of investments and the income derived from investments will fluctuate and can go down as well as up. A loss of principal may occur.
This information discusses general market activity, industry or sector trends, or other broad-based economic, market or political conditions and should not be construed as research or investment advice. This material has been prepared by Goldman Sachs Asset Management and is not financial research nor a product of Goldman Sachs Global Investment Research (GIR). It was not prepared in compliance with applicable provisions of law designed to promote the independence of financial analysis and is not subject to a prohibition on trading following the distribution of financial research. The views and opinions expressed may differ from those of Goldman Sachs Global Investment Research or other departments or divisions of Goldman Sachs and its affiliates. Investors are urged to consult with their financial advisors before buying or selling any securities. This information may not be current and Goldman Sachs Asset Management has no obligation to provide any updates or changes.
Views and opinions expressed are for informational purposes only and do not constitute a recommendation by Goldman Sachs Asset Management to buy, sell, or hold any security. Views and opinions are current as of the date of this presentation and may be subject to change, they should not be construed as investment advice.
Individual portfolio management teams for Goldman Sachs Asset Management may have views and opinions and/or make investment decisions that, in certain instances, may not always be consistent with the views and opinions expressed herein.
This material is for informational purposes only. It has not been, and will not be, registered with or reviewed or approved by your local regulator. This material does not constitute an offer or solicitation in any jurisdiction. If you do not understand the contents of these materials, you should consult an authorised financial adviser.
United States: In the United States, this material is offered by and has been approved by Goldman Sachs Asset Management, L.P., which is a registered investment adviser with the Securities and Exchange Commission.
United Kingdom: In the United Kingdom, this material is a financial promotion and has been approved by Goldman Sachs Asset Management International, which is authorized and regulated in the United Kingdom by the Financial Conduct Authority.
European Economic Area (EEA): This marketing communication is disseminated by Goldman Sachs Asset Management B.V., including through its branches (“GSAM BV”). GSAM BV is authorised and regulated by the Dutch Authority for the Financial Markets (Autoriteit Financiële Markten, Vijzelgracht 50, 1017 HS Amsterdam, The Netherlands) as an alternative investment fund manager (“AIFM”) as well as a manager of undertakings for collective investment in transferable securities (“UCITS”). Under its licence as an AIFM, the Manager is authorized to provide the investment services of (i) reception and transmission of orders in financial instruments; (ii) portfolio management; and (iii) investment advice. Under its licence as a manager of UCITS, the Manager is authorized to provide the investment services of (i) portfolio management; and (ii) investment advice. Information about investor rights and collective redress mechanisms are available on www.gsam.com/responsible-investing (section Policies & Governance). Capital is at risk. Any claims arising out of or in connection with the terms and conditions of this disclaimer are governed by Dutch law.
In the European Union, this material has been approved by either Goldman Sachs Asset Management Funds Services Limited, which is regulated by the Central Bank of Ireland or Goldman Sachs Asset Management B.V, which is regulated by The Netherlands Authority for the Financial Markets (AFM).
France: FOR PROFESSIONAL USE ONLY (WITHIN THE MEANING OF THE MIFID DIRECTIVE)- NOT FOR PUBLIC DISTRIBUTION. THIS DOCUMENT IS PROVIDED FOR SPECIFIC INFORMATION PURPOSES ONLY IN ORDER TO ENABLE THE RECIPIENT TO ASSESS THE FINANCIAL CHARACTERISTICS OF THE CONCERNED FINANCIAL INSTRUMENT(S) AS PROVIDED FOR IN ARTICLE L. 533-13-1, I, 2° OF THE FRENCH MONETARY AND FINANCIAL CODE AND DOES NOT CONSTITUTE AND MAY NOT BE USED AS MARKETING MATERIAL FOR INVESTORS OR POTENTIAL INVESTORS IN FRANCE.
Switzerland: For Qualified Investor use only – Not for distribution to general public. This is marketing material. This document is provided to you by Goldman Sachs Asset Management Schweiz Gmbh. Any future contractual relationships will be entered into with affiliates of Goldman Sachs Asset Management Schweiz Gmbh, which are domiciled outside of Switzerland. We would like to remind you that foreign (Non-Swiss) legal and regulatory systems may not provide the same level of protection in relation to client confidentiality and data protection as offered to you by Swiss law.
Asia excluding Japan: Please note that neither Goldman Sachs Asset Management (Hong Kong) Limited (“GSAMHK”) or Goldman Sachs Asset Management (Singapore) Pte. Ltd. (Company Number: 201329851H ) (“GSAMS”) nor any other entities involved in the Goldman Sachs Asset Management business that provide this material and information maintain any licenses, authorizations or registrations in Asia (other than Japan), except that it conducts businesses (subject to applicable local regulations) in and from the following jurisdictions: Hong Kong, Singapore, India and China. This material has been issued for use in or from Hong Kong by Goldman Sachs Asset Management (Hong Kong) Limited and in or from Singapore by Goldman Sachs Asset Management (Singapore) Pte. Ltd. (Company Number: 201329851H).
Australia: This material is distributed by Goldman Sachs Asset Management Australia Pty Ltd ABN 41 006 099 681, AFSL 228948 (‘GSAMA’) and is intended for viewing only by wholesale clients for the purposes of section 761G of the Corporations Act 2001 (Cth). This document may not be distributed to retail clients in Australia (as that term is defined in the Corporations Act 2001 (Cth)) or to the general public. This document may not be reproduced or distributed to any person without the prior consent of GSAMA. To the extent that this document contains any statement which may be considered to be financial product advice in Australia under the Corporations Act 2001 (Cth), that advice is intended to be given to the intended recipient of this document only, being a wholesale client for the purposes of the Corporations Act 2001 (Cth). Any advice provided in this document is provided by either of the following entities. They are exempt from the requirement to hold an Australian financial services licence under the Corporations Act of Australia and therefore do not hold any Australian Financial Services Licences, and are regulated under their respective laws applicable to their jurisdictions, which differ from Australian laws. Any financial services given to any person by these entities by distributing this document in Australia are provided to such persons pursuant to the respective ASIC Class Orders and ASIC Instrument mentioned below.
* Goldman Sachs Asset Management, LP (GSAMLP), Goldman Sachs & Co. LLC (GSCo), pursuant ASIC Class Order 03/1100; regulated by the US Securities and Exchange Commission under US laws.
* Goldman Sachs Asset Management International (GSAMI), Goldman Sachs International (GSI), pursuant to ASIC Class Order 03/1099; regulated by the Financial Conduct Authority; GSI is also authorized by the Prudential Regulation Authority, and both entities are under UK laws.
* Goldman Sachs Asset Management (Singapore) Pte. Ltd. (GSAMS), pursuant to ASIC Class Order 03/1102; regulated by the Monetary Authority of Singapore under Singaporean laws
* Goldman Sachs Asset Management (Hong Kong) Limited (GSAMHK), pursuant to ASIC Class Order 03/1103 and Goldman Sachs (Asia) LLC (GSALLC), pursuant to ASIC Instrument 04/0250; regulated by the Securities and Futures Commission of Hong Kong under Hong Kong laws
No offer to acquire any interest in a fund or a financial product is being made to you in this document. If the interests or financial products do become available in the future, the offer may be arranged by GSAMA in accordance with section 911A(2)(b) of the Corporations Act. GSAMA holds Australian Financial Services Licence No. 228948. Any offer will only be made in circumstances where disclosure is not required under Part 6D.2 of the Corporations Act or a product disclosure statement is not required to be given under Part 7.9 of the Corporations Act (as relevant).
FOR DISTRIBUTION ONLY TO FINANCIAL INSTITUTIONS, FINANCIAL SERVICES LICENSEES AND THEIR ADVISERS. NOT FOR VIEWING BY RETAIL CLIENTS OR MEMBERS OF THE GENERAL PUBLIC.
Canada: This presentation has been communicated in Canada by GSAM LP, which is registered as a portfolio manager under securities legislation in all provinces of Canada and as a commodity trading manager under the commodity futures legislation of Ontario and as a derivatives adviser under the derivatives legislation of Quebec. GSAM LP is not registered to provide investment advisory or portfolio management services in respect of exchange-traded futures or options contracts in Manitoba and is not offering to provide such investment advisory or portfolio management services in Manitoba by delivery of this material.
Japan: This material has been issued or approved in Japan for the use of professional investors defined in Article 2 paragraph (31) of the Financial Instruments and Exchange Law (“FIEL”). Also, Any description regarding investment strategies on collective investment scheme under Article 2 paragraph (2) item 5 or item 6 of FIEL has been approved only for Qualified Institutional Investors defined in Article 10 of Cabinet Office Ordinance of Definitions under Article 2 of FIEL.
Hong Kong: This material has been issued or approved for use in or from Hong Kong by Goldman Sachs Asset Management (Hong Kong) Limited, a licensed entity regulated by the Securities and Futures Commission of Hong Kong (SFC). This material has not been reviewed by the SFC. © 2025 Goldman Sachs. All rights reserved.
Singapore: Investment involves risk. Prospective investors should seek independent advice. This advertisement or publication material has not been reviewed by the Monetary Authority of Singapore. This material has been issued or approved for use in or from Singapore by Goldman Sachs Asset Management (Singapore) Pte. Ltd. (Company Number: 201329851H).
Kuwait: FOR YOUR INFORMATION ONLY – NOT FOR WIDER DISTRIBUTION. This material has not been approved for distribution in the State of Kuwait by the Ministry of Commerce and Industry or the Central Bank of Kuwait or any other relevant Kuwaiti government agency. The distribution of this material is, therefore, restricted in accordance with law no. 31 of 1990 and law no. 7 of 2010, as amended. No private or public offering of securities is being made in the State of Kuwait, and no agreement relating to the sale of any securities will be concluded in the State of Kuwait. No marketing, solicitation or inducement activities are being used to offer or market securities in the State of Kuwait.
Qatar: FOR YOUR INFORMATION ONLY – NOT FOR WIDER DISTRIBUTION. This document has not been, and will not be, registered with or reviewed or approved by the Qatar Financial Markets Authority, the Qatar Financial Centre Regulatory Authority or Qatar Central Bank and may not be publicly distributed. It is not for general circulation in the State of Qatar and may not be reproduced or used for any other purpose.
Saudia Arabia: FOR YOUR INFORMATION ONLY – NOT FOR WIDER DISTRIBUTION. The Capital Market Authority does not make any representation as to the accuracy or completeness of this document, and expressly disclaims any liability whatsoever for any loss arising from, or incurred in reliance upon, any part of this document. If you do not understand the contents of this document you should consult an authorised financial adviser.
UAE: FOR YOUR INFORMATION ONLY – NOT FOR WIDER DISTRIBUTION. This document has not been approved by, or filed with the Central Bank of the United Arab Emirates or the Securities and Commodities Authority. If you do not understand the contents of this document, you should consult with a financial advisor.