Market Pulse July

We believe today’s market concentration—particularly in US and emerging market equities—is increasingly justified by strong fundamentals, but also raises the risk of volatility, cyclicality, and single-stock exposure. Overall, we would stay invested in growth opportunities while using diversification, income strategies, and alternatives to build portfolio resilience.
For a deeper dive, visit our Investment Views from Our CIOs.
Macro Views
We expect risk assets to move higher in H2 2026, led by resilient growth and continued AI momentum. In our view, macro risks are more balanced. Hawkish monetary policy could weigh on valuations while faster-than-expected disinflation may broaden equity leadership and support core fixed income. We believe geopolitics and AI will remain key themes impacting portfolios.
Past geopolitical shocks historically saw inflation rise and private investment retreat, with public spending increasing on a lag. Today, the dynamics differ. AI is driving non-discretionary private capital spending. With tech investment anchoring growth, investors should focus on persistent inflation, in our view.
AI investments may reach ~1.5% of US GDP this year, just below the 1990s tech peak. Although this spending boom is accelerating, robust profit growth has largely prevented dot-com-era imbalances. Specifically, earnings and profit margins have risen to new highs, corporate sector financial balance has stayed healthy, and current account position has improved.
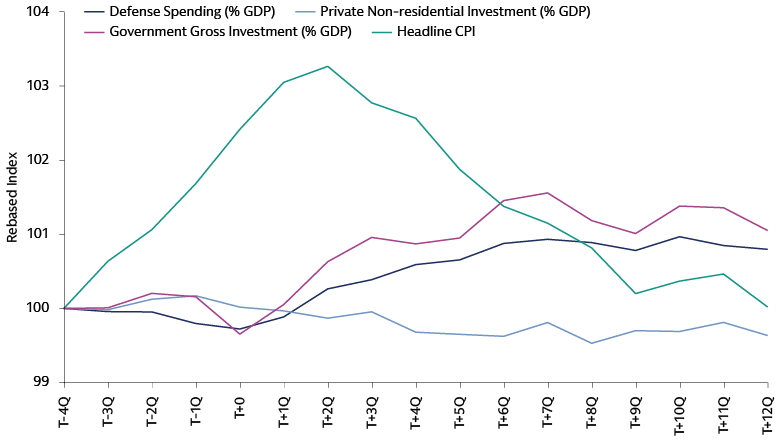
Source: Dario Caldara and Matteo Iacoviello, Macrobond and Goldman Sachs Asset Management. As of July 1, 2026. Series are shown as an average across eight major geopolitical shock episodes identified using the Geopolitical Risk (GPR) index: the Korean War onset (1950 Q3), Cuban Missile Crisis (1962 Q4), Vietnam escalation (1965 Q3), Yom Kippur War/Oil Shock (1973 Q4), Iran Hostage Crisis (1979 Q4), Gulf War/Desert Storm (1990 Q3), 9/11 attacks (2001 Q3), and the Russia-Ukraine war (2022 Q1). For each episode, T+0 is the shock quarter, and each series is rebased to 100 at T-4 (four quarters before the event) to show the cumulative path from one year before to three years after the shock. Past performance does not predict future returns and does not guarantee future results, which may vary.
Market Views
We remain constructive on global equities, particularly in the US and EM as AI investment drives robust corporate earnings. We believe market broadening can continue, with consensus forecasting Q2 EPS growth of 22% YoY for the S&P 500 and 9% for the median stock. Meanwhile, a greater focus on energy, defense, and economic security has led to a surge in public investment and potential opportunities in infrastructure and industrials globally.
Diverging central banks create potential opportunities for global income investors both within and beyond rate markets. Corporate credit fundamentals remain solid despite macro headwinds. High dividend equities and high-quality fixed income offer resilient cash flows, while private credit delivers compelling yield premiums, in our view. This environment favors active selection, capturing resilient carry while managing downside risks.
Managing market volatility highlights the role of alternative assets beyond traditional equities and bonds. We think private infrastructure remains attractive, delivering resilient cash flows and robust inflation hedging. Meanwhile, liquid alternatives may offer uncorrelated returns to buffer portfolios. Incorporating buffer ETFs may provide both equity exposure and downside protection, enhancing portfolio resilience during market stress.
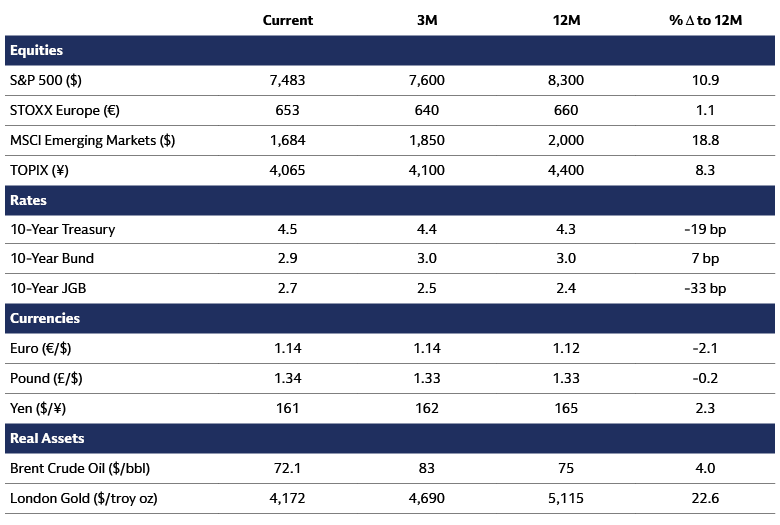
Asset Class Forecasts: Price targets of major asset classes are provided by Goldman Sachs Global Investment Research. As of July 6, 2026.
Justifiably Concentrated, Justifiably Concerned
Concentration has increased across global markets in recent decades, in part because technology has enabled a small number of firms to leverage economies of scale and capture larger market shares. As these companies have also captured growing profit pools, concentration may be a more durable feature of today’s market. While not necessarily a cause for concern in itself, we think investors should recognize how concentration is changing the composition of equity portfolios, making them potentially more cyclical, volatile, and growth-oriented than in periods past, requiring a more dynamic approach to portfolio construction.
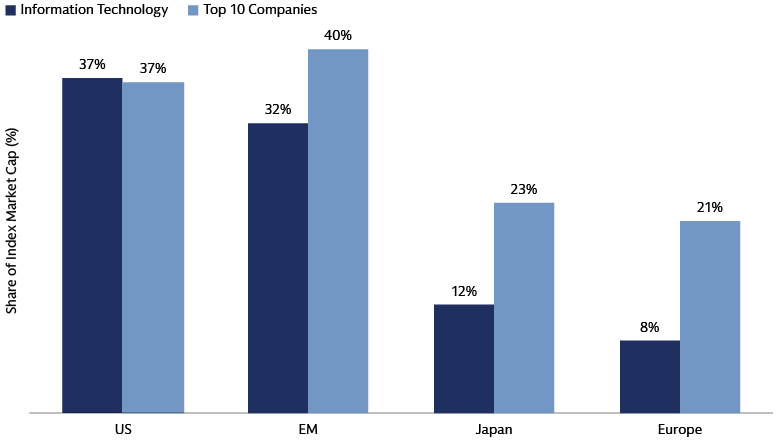
Source: Bloomberg and Goldman Sachs Asset Management. As of June 30, 2026. Chart shows the share of index market cap for the S&P 500, MSCI Europe, Topix, and MSCI Emerging Markets.
Tech-driven market concentration has accelerated in the US and Emerging Markets, with the 10 largest companies now representing roughly 40% of each market. Diversification looks better in developed markets outside of the US, where both sector exposures and market leaders are more differentiated. We would continue to look to the US and EM for potential growth/tech opportunities but view the value tilt of Europe and Japan as an important complement in a portfolio.
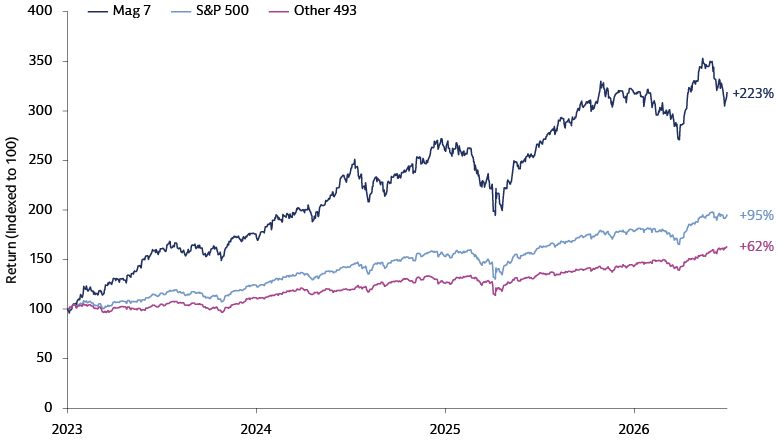
Source: Bloomberg and Goldman Sachs Asset Management. As of June 30, 2026. Chart shows performance of the S&P 500, UBS Magnificent 7, and the S&P 500 minus the Magnificent 7, indexed to January 2023. Magnificent 7 refers to Microsoft, Meta, Alphabet, Amazon, Apple, Nvidia, and Tesla.
Despite their underperformance YTD, the largest stocks in the S&P 500 have driven outsized returns in recent years, driven by outsized earnings. The Magnificent 7 accounts for 29% of the index by market cap and 28% of index earnings. Such strong fundamentals can justify elevated levels of market concentration, in our view. Even so, we know that it’s hard to outgrow the market in the long run. Since 1990, on average only six top 10 companies have still been in the top 10 five years later.
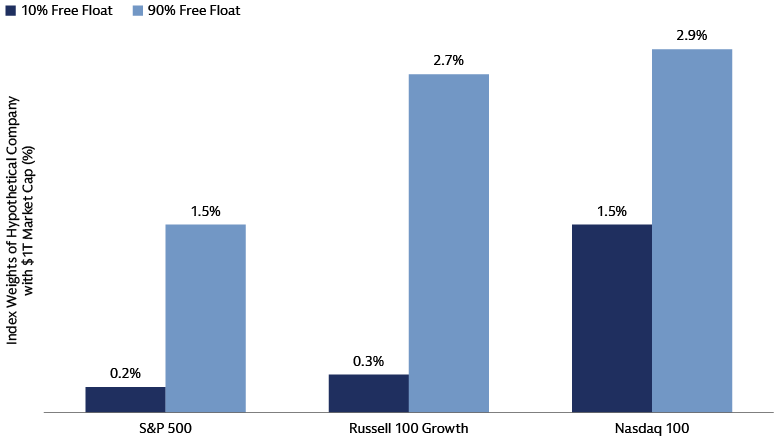
Source: Goldman Sachs Global Investment Research. As of June 30, 2026. Chart shows approximate pro-forma index weights of a hypothetical company with a $1 trillion market cap.
The addition of mega-cap IPOs to the market will further push concentration limits. While initial float may be low and index weights manageable, that will rise as more shares come to market over time. Historical data tells us that IPO activity has very little explanatory power on the returns of the market in the subsequent one year period. However, it does remind us of the importance of risk management and diversification as new issuance and single stock exposure can both generate increased volatility.