Systematically Identifying Potential Biodiversity Risks
Investor awareness and focus on biodiversity is on the rise. In “Making Biodiversity Investing Actionable”, we highlighted a possible framework for investors to begin clarifying their biodiversity objectives and then select tools to identify and access potential investment opportunities. Here, we build on that framework by sharing a methodology to evaluate potential biodiversity risks at a company level. We also explore risk-aware approaches to generate a biodiversity-optimized public market portfolio, then contrast that portfolio with existing biodiversity investment funds.
Mapping the Risks
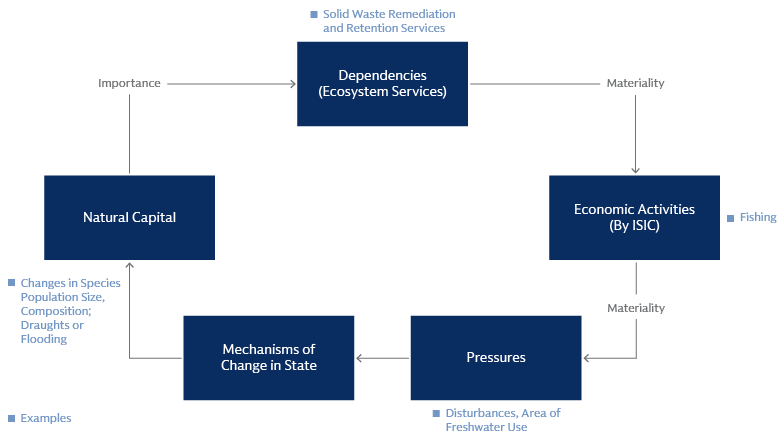
When assessing potential biodiversity risks, we look for the impact that companies may have on nature, as well as for the impact that nature may have on companies. We adopt terminology used in recently updated materiality ratings by ENCORE (Exploring Natural Capital Opportunities, Risks and Exposure), an open-sourced biodiversity tool.1 These ratings are grounded in a substantial body of research and highlight potential pressures (impact on nature) and dependencies (impact from nature) from economic activities.2 From this materiality map we consider the “high” and “very high” materialities of each economic activity.
Source: ENCORE. Goldman Sachs Asset Management Sustainable Investment Platform. As of February 1, 2025. Goldman Sachs Asset Management’s and ENCORE’s products are not related, and ENCORE has not endorsed either Goldman Sachs Asset Management or its products. For illustrative purposes only.
As the graphic above illustrates, fishing is one example of how an economic activity can affect natural capital. In terms of dependencies, fishing depends on solid waste remediation by ecosystems (e.g., micro-organisms, algae, plants and animals) to break down water contaminants (e.g., microorganisms mitigate the impacts of heavy metal pollutants). When translating economic activity to pressures, or impacts, fishing assigns a “high” or “very high” materiality rating to disturbances, such as noise and light pollution, which can be a stressor to marine life ecosystems. These pressures become relevant for the mechanisms of change in state—processes that cause alterations in the state of ecosystems and impacts their ability to continue providing goods and services. For example, harmful microbes, droughts or flooding may lead to changes in marine life species populations.
After considering materiality ratings, we identify which economic activities are likely occurring within a taxonomy of over 1600 standardized business segments that a company can be involved in.3 By connecting business segments and economic activities, we can determine potential biodiversity risks at the business segment level. This information can then be aggregated to the company and portfolio levels. Comparing this business segment perspective on potential biodiversity risk with a more simplistic sector-based perspective, we find that the former allows for a more nuanced analysis. Even when using very granular sectors, a sector-based approach places each company in only one sector.
Many companies operate in multiple business areas, leading to potential over or underestimation of biodiversity risks. Comparing the granular sector approach with the segment approach, the table below shows how a materiality assessment can change when considering the revenues of a global equity benchmark. 83% of revenues identified as having very high pressure by the sector approach remain classified as such. The other 17% of revenues are assessed with lower materiality, with changes for highly (H) material risks even larger: 19% of revenues that under a sector approach are deemed highly material see their materiality increasing to the highest bracket ‘Very High’. Using revenue streams allows for a more nuanced view of potential biodiversity risks. In cases where data is lacking, this approach helps evaluate parts of businesses that would otherwise lack information based solely on sector classification.

Source: FactSet, MSCI, Goldman Sachs Asset Management Sustainable Investment Platform. Reference Universe: MSCI ACWI Investable Market Index (IMI). As of December 31, 2024. Sector Materiality defined as average materiality at RBICS L4 (383 sectors)
For illustration of this effect at a firm level, one could consider a coffee company that has its own coffee production activities next to its shops. Coffee production comes with different intensity of pressures and dependencies than running a coffee shop. Alternatively, a large conglomerate that initially would get grouped as diversified insurance company is associated with only low and very low pressures. However, a construction or railroad transportation segment would bring higher potential for negative pressures. By adopting this data-driven approach, investors can unlock the capability to systematically screen complete equity universes4 and close to complete corporate bond universes.5 It also enables a review of potential biodiversity risks at the asset class level. The table below lists the share of aggregate asset class revenues that potentially pressure nature.

Source: Bloomberg, ENCORE, FactSet, IBPES, MSCI, GSAM Sustainable Investment Platform. Global Equity represented by MSCI All Countries World Index and Global Credit by Bloomberg Global Aggregate - Corporate Index. Data as of November 30, 2024. A single company can pressure nature via multiple drivers of biodiversity loss at the same time, hence numbers are not necessarily additive.
From a dependency perspective, water is the topic that floats to the top of the exposure list. The three key ecosystems services are the same for both asset classes, underscoring their importance: water purification (13% and 11% of revenues), water flow regulation (13%, 16%), and water supply (13%, 15%).
Using business segment information increases the granularity of the analyses compared to a sector approach, for example, as segments introduce some company specific information. The methodology does have limitations, however, as it does not consider spatial information.6 The availability of spatial information is growing but systematically considering location specific information remains a complex task. We expect future advancements in this area. For example, Goldman Sachs recently joined the MIT-IBM Watson AI Lab to help advance the application of artificial intelligence to biodiversity measurement. Supply chain information can also be relevant for a richer assessment. In this article, we focus solely on identifying potential biodiversity risks without considering spatial or supply chain considerations.
Portfolio Impacts from Reducing Potential Biodiversity Risks
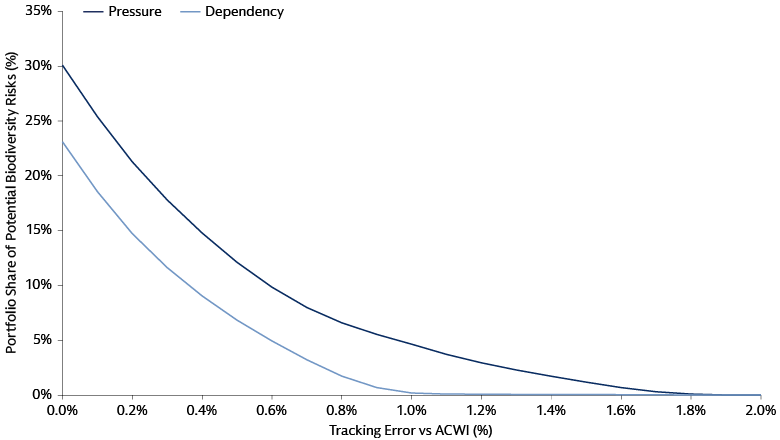
Investors that integrate sustainability characteristics into their portfolios are likely to deviate from their starting universe. One way to express the extent to which investors deviate from a benchmark (or starting universe) is by using tracking error. In the chart below, we highlight how much deviation from a global equity benchmark is needed to reduce potential biodiversity risks by various percentages. Both pressures and dependencies are forms of risk. A tracking error of 0.4% is associated with a 50% smaller exposure to both pressures and dependencies (from 30% and 24% of aggregated revenues to below 15% and 12%). The shapes of both curves suggest that increasingly more tracking error budget is required for each extra percent of biodiversity risk reduction.
Source: Axioma, FactSet, MSCI, Goldman Sachs Asset Management Sustainable Investment Platform as of December 31, 2024.
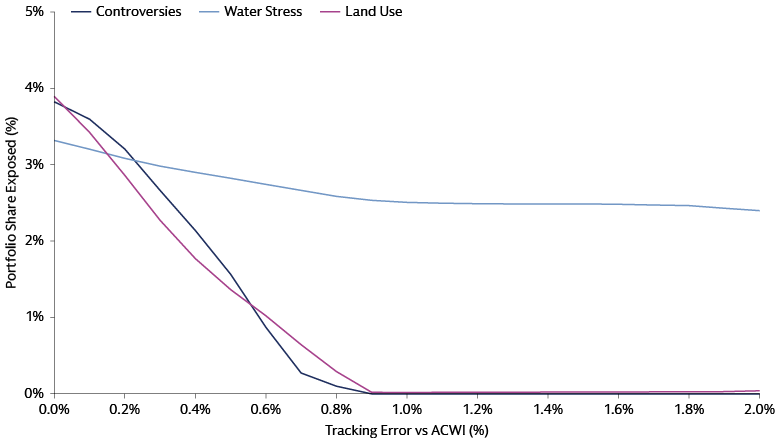
Using this lens of portfolios that are incrementally reducing their potential biodiversity risk as their tracking error budget grows also provides a starting point for comparing to other metrics of biodiversity risk. The chart below shows how reducing potential biodiversity risks using the business segment approach similarly reduces the portfolio exposure to companies with 1) biodiversity related controversies, 2) operational exposure to water related risks, and 3) activities that have potential disturbances to land and marine areas.
Source: Axioma, FactSet, MSCI, Sustainalytics, Goldman Sachs Asset Management Sustainable Investment Platform. As of December 31, 2024.
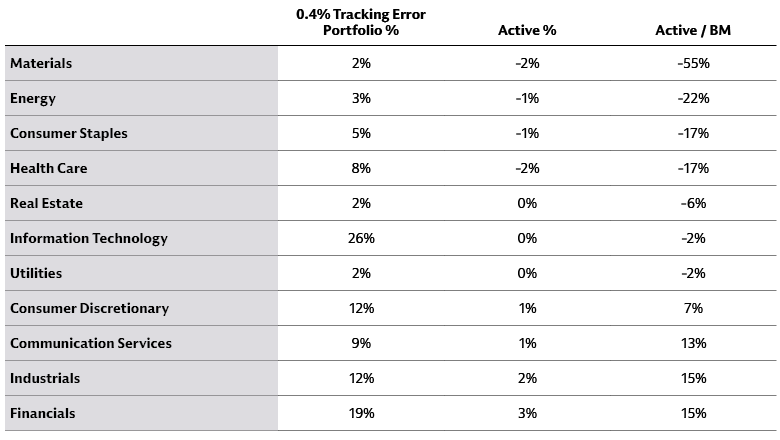
Diving deeper into the drivers of the tracking error, the table below shows which sector tilts are introduced. Although deviations are within a band of 2% around the index weight, for a sector like materials this does imply a halving of its share of the portfolio. Different than for the materials and energy sectors, the healthcare sector is mostly underweighted because of its dependencies on eco-system services (instead of pressures). We also note the limited change to industrials and utilities, two sectors typically in scope when a biodiversity related topic, climate risk, is evaluated.
Source: ENCORE, FactSet, MSCI, GSAM Sustainable Investment Platform. Data as of December 31, 2024.
We also look at the 0.4% tracking error portfolio from a factor perspective. The table below shows how the modelled portfolio gets a small profitability and size tilt.
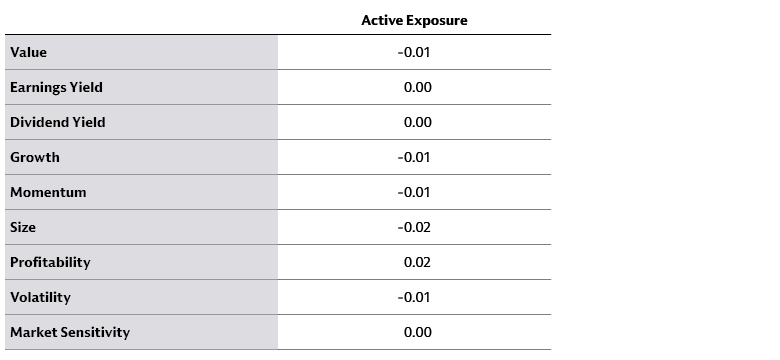
Source: Axioma, ENCORE, FactSet, MSCI, Goldman Sachs Asset Management Sustainable Investment Platform. Data as of December 31, 2024.
Comparing Biodiversity-themed Investments
To understand how the investable universe changes and how portfolio characteristics compare to existing biodiversity products, we consult a fund database and consider all listed equity funds with a global scope. We select the 10 largest funds that have "biodiversity" in their name and a Sustainable Finance Disclosure Regulation (SFDR) classification of article 8 or 9. As of December 31, 2024, these funds had a combined total of US$774 million in assets under management (AUM). From reviewing the available fund materials, we find that most investment processes include both biodiversity risk considerations and positive biodiversity exposures.
To improve comparability, we add a measure of positive biodiversity exposure to the discussed potential biodiversity risk measure. We define positive biodiversity exposure as the net share of a firm's revenue that contributes positively to any of the biodiversity-relevant Sustainable Development Goals (SDGs) 12, 13, 14, and 15.7
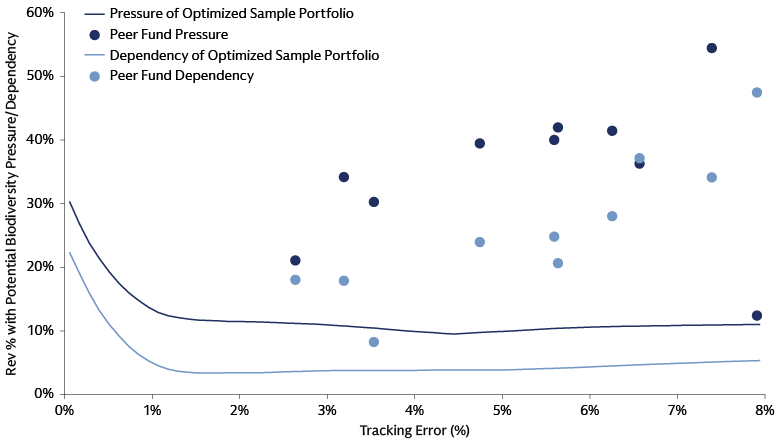
Starting with the global equity universe, we create optimized portfolios that minimize potential biodiversity risk and maximize SDG exposure simultaneously. The charts below show the tracking error required for each optimized portfolio to reduce potential risks and increase positive biodiversity exposure equally. As shown in the Biodiversity Controversies, Water Risk, and Disturbances chart above (which did not consider positive exposures), potential biodiversity risks can still decrease quickly, even with a dual goal. The tracking error needed to reduce potential risks by 50% increases from 0.4% to 0.7%.
Source: Axioma, Factset, MSCI, Goldman Sachs Asset Management Sustainable Investment Platform as of December 31st, 2024.
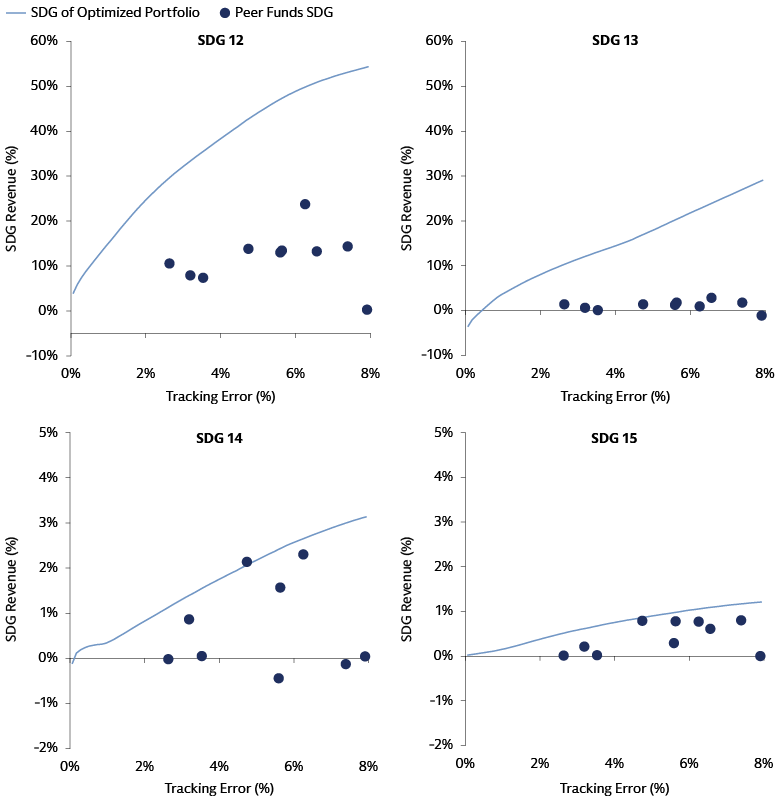
Source: Axioma, Factset, MSCI, Goldman Sachs Asset Management Sustainable Investment Platform. As of December 31, 2024.
Importantly, there is a possibility to reduce potential biodiversity risks and increase positive biodiversity exposure at the same time, and this can be done under various tracking error budgets. This highlights that the portfolios optimized under the assumptions of this framework require less tracking error budget per unit of improvement than the existing biodiversity products evaluated, whereby the unit of improvement is a reduction of potential risks or an increase in positive exposure. An assumption here is that those live strategies have similar considerations as the optimized portfolios we have used for this illustration. Despite careful filtering, the biodiversity funds are likely to use different metrics to evaluate biodiversity risk and positive exposure, which may explain away part of the differences we find. In line with the risk only approach, the optimized portfolios have limited style tilts, with the resulting 0.7% tracking error portfolio—the one that reduces potential risk by 50% having a 0.04 active small cap tilt as largest style exposure.
Efficient Biodiversity Risk Consideration
We find it is possible to efficiently consider potential biodiversity risks when constructing portfolios with public market securities. Despite its limitations, we believe the methodology outlined above benefits from its simplicity and broad applicability. Key portfolio metrics like sector distributions and style factors change, and a limited tracking error budget can allow noticeable change to the biodiversity profile of a portfolio. As we highlighted, modelled portfolios behave similarly on other, more established biodiversity metrics. It is also feasible to increase positive biodiversity exposure while reducing potential biodiversity risks.
1 ENCORE. Accessed January 22, 2025.
2 ENCORE. As of October 2024.
3 Factset. As of December 31, 2024.
4 MSCI All Countries World Index.
5 97% of Bloomberg Global Aggregate - Corporate Index, as of November 30, 2024.
6 ENCORE. Accessed January 22, 2025.
7 Responsible Consumption and Production (12), Climate Action (13), Life below Water (14), Life on Land (15).
