Equity Index Concentration and Portfolio Implications
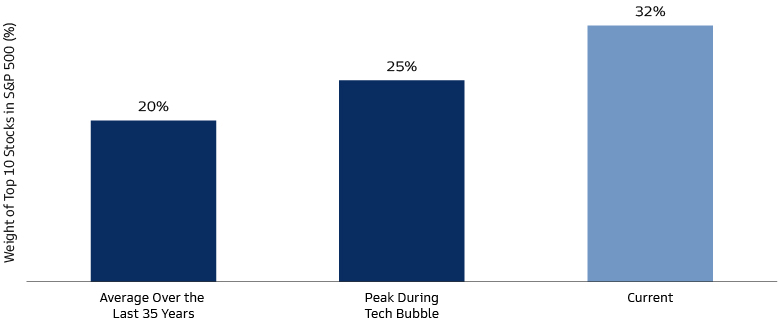
The S&P 500 is more concentrated than it has ever been. Over the last 35 years, the average weight of top 10 stocks in the S&P 500 index has been 20%. During the dot-com bubble, the combined weight of top 10 stocks peaked at 25%. At present, the figure stands at 32%. In both cases, the top names in the index were technology and internet companies. However, that is where the parallels end.

Source: S&P, Bloomberg and Goldman Sachs Multi Asset Solutions As of Date is October 23, 2023. This material is provided for educational purposes only and should not be construed as investment advice or an offer or solicitation to buy or sell securities. Past performance does not guarantee future results, which may vary. The economic and market forecasts presented herein are for informational purposes as of the date of this presentation. There can be no assurance that the forecasts will be achieved. Please see additional disclosures at the end of this presentation.
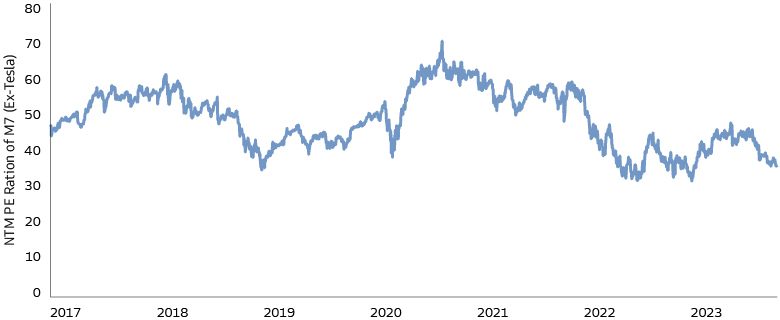
In the aftermaths of the dot-com bubble, index concentration resolved by itself as Tech companies were viciously repriced lower. The Magnificent Seven (“M7”) stocks that collectively account for more than 100% of YTD 2023 returns only represent 27.5% of the index. Unlike during the tech bubble, these companies are rich in cash, are highly profitable, and have expected growth rates and margins double that of the rest of the market. Fundamentals justify their current valuation, and the M7 names are also trading largely in line with their historical valuation. Moreover, given the unique competitive advantages of M7 companies, there are reasons to believe that the index concentration phenomenon may persist for a while in the current environment.

Source: Bloomberg, Goldman Sachs Asset Management Multi-Asset Solutions. As of date: October 23, 2023. Tesla has been excluded as it started posting full year profits FY 2020 onwards. Tesla is also trading below its average NTM PE ratio since Jan 2020. Therefore, the observation would continue to hold if Tesla were included.
Today’s market conditions may prompt some institutional investors to assess potential asset allocation implications, especially those who obtain equity beta exposures mainly through passive vehicles. If left on its own, portfolio exposures could become increasingly lopsided as the index concentration issue persists. To address this problem, potential approaches may include:
- Continuing to obtain equity exposure in the same market-cap weighted format, with the possibility to dynamically adjust the weight allocated to equities, and/or overlay with macro hedges or
- Directly controlling the degree of concentration by creating customized baskets and re-weighting the names within the index (for example, use equal-weighted index or apply other constraints on the cap-weighted index).
To assess the pros and cons of different approaches, we would like to discuss the strategic and dynamic considerations respectively.
Strategic Asset Allocation Considerations
For a strategic asset allocation perspective, the Multi-Asset Solutions ("MAS") view is that market-cap-weighting is the most efficient way to gain exposure to the equity risk premium in the absence of an active view. The theoretical underpinning of this view goes back to the Capital Asset Pricing Model, which formulates the foundation of the MAS investment process. Deeper dives suggest that higher multiples or low equity risk premia at the headline level are not reasons to deviate from market-cap-weighted equity exposure on a long-term strategic basis.
Adopting an equal-weighted index would effectively introduce an overweight (“OW”) bias towards smaller capitalization stocks, a so-called equity “size” factor tilt. Empirical studies find that the efficacy of the “size” factor has diminished meaningfully in recent years. MAS analysis suggests that there may be diversifying sources of risk premia coming from other equity style factors, such as momentum, quality, and min-vol; however, our conviction in the size factor has remained low.
Alternatively, some investors may consider customized baskets with weight constraints, or excluding the M7 from the index altogether. Our correlation analysis shows that investing in cap-weighted indices continues to offer more diversification than excluding the M7. Furthermore, from a vehicle perspective, traditional market cap indices are likely to have higher availability and lower cost than customized baskets, although the difference could be improving over time with enhanced implementation and better scalability. Overall, we believe that equity exposures should remain market-cap weighted, at least in the long-term strategic sense.
Dynamic Asset Allocation Considerations
From a dynamic asset allocation perspective, the questions are 1) Is the current macro and market environment favorable for introducing some short-term factor tilts or weight constraints as an overlay to the market-cap index, and 2) Is the high degree of index concentration indicative of broader vulnerabilities, and should it trigger any reassessment of cross-asset allocation.
In our view, the current macro backdrop should be characterized as being in late-cycle although not end of cycle. Such an environment is generally not favorable for smaller stocks, because they are typically more cyclical, more domestically exposed, less profitable, have weaker balance sheet – and therefore more vulnerable in late-cycle. From a valuation perspective, there are reasons to believe that concerns around small cap may have become overblown, and the macro backdrop could turn favorable if a soft-landing scenario were to materialize, yet in our view a clear catalyst for OW small cap has not emerged so far. In the context of the index concentration discussion, we don’t see a strong case for replacing market-cap exposure with equal-weight exposures at the moment, although this view will possibly shift as market evolves.1

Source: Bloomberg and Goldman Sachs Multi Asset Solutions As of date: 18th October 2023.
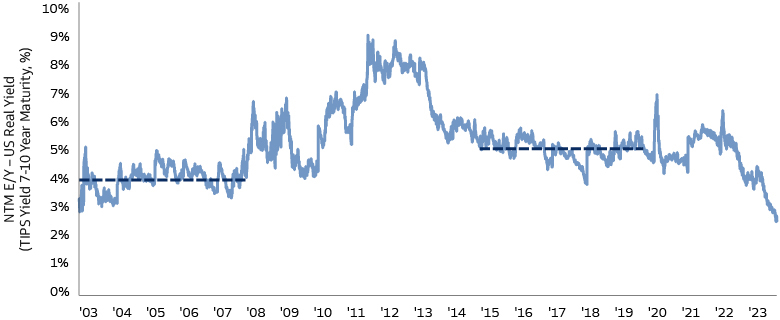
In terms of cross-asset allocation, we believe that the current high valuation and high concentration of the market can be attributable to the fact that stocks that deserve higher multiples now account for a larger share of the market. While at the headline level, the S&P 500 index equity risk premium at 2.8% is the lowest it has been in the last 20 years, when we split the market into M7 and S&P 500 ex M7, a different picture emerges: S&P 500 ex M7 offers a risk premium of 4.2%, which is higher than the average between 2003 and 2008, when interest rates were in a similar range. Further, the majority of the M7 stocks are trading around their long-term valuation. In other words, relative to their own historical ranges, valuations in both the M7 and the other 493 stocks of the index do not screen as expensive.
Also, the narrowness of the equity rally earlier this year does not necessarily suggest reduced equity allocation. Historical analysis of the relationship between market breadth and returns shows that narrow rallies do not necessarily imply elevated risk of future decline (using both the percentage of stocks trading above their 200-day moving average and the performance of equal-weighted S&P500 vs market cap-weighted S&P 500 as proxies for market breadth). Conversely, improving breadth during equity declines can be indicative of a market bottom, though current market breadth measures do not indicate a strong signal in either direction.
Furthermore, asset-allocation implications should also be viewed in the context of portfolio objectives. For example, as M7 stocks have accounted for more than 100% of equity index returns year-to-date, the degree of concentration has suppressed volatility at the index level, which in turn may point to higher equity allocation for vol-targeting strategies. Our colleagues in Quantitative Investment Strategies (QIS) observe that there is a tug-of-war in portfolio volatility coming from higher correlation between equity and fixed income juxtaposed to lower equity market volatility, and at the moment, the low volatility of equities is the more impactful of the two on total portfolio volatility. Within a vol-targeting context, this would mean leaning further into equities and the associated duration, even though some other systematic signals may suggest a more cautious picture.
Taken Altogether
Generally, we believe that long-term strategic allocations to equities should remain anchored around market-cap weights and the lack of market breadth by itself is an insufficient condition to reduce equity allocation. The currently elevated levels of concentration in equity indices are supported by robust fundamentals in the M7 stocks, and therefore should not be a cause of concern by and on itself. The portfolio construction implications are worth noting, as look-through exposures are now more lopsided than before and unlikely to self-correct in the foreseeable future. Portfolio decisions should be made case-by-case based on investment objectives, constraints, opportunity set available, and the costs associated with the range of options. Asset allocation implications for customized objectives, such as vol-targeting, may not always coincide with return-oriented objectives.2 There may be opportunities to tilt the portfolio towards certain factors, which should be assessed against the macro and market backdrop and managed dynamically.
1 The economic and market forecasts presented herein are for informational purposes as of the date of this presentation. There can be no assurance that the forecasts will be achieved. Please see additional disclosures at the end of this presentation.
2 No assurance can be given that the client’s investment objective may be achieved.
