Time to Shine? A Small Cap Reversal of Fortune
The global universe of small caps has a variety of companies across continents with diverse revenue streams. It also provides access to the higher growth potential of tomorrow’s future mid- and large-cap leaders. In recent years, small caps have faced headwinds from higher interest rates and been overshadowed by large US mega-cap names fueled by advances in artificial intelligence. More recently, however, we believe a reversal of fortune has occurred. Small caps outperformed larger peers over the summer, aided by the start of interest rate easing cycles. We see potential for an extended small-cap run given that valuations are below their long-term averages, and we believe active investment strategies are best-placed to capitalize.
Macro Headwinds Turn to Tailwinds
The phase of fast and forceful monetary policy tightening that began in 2022 was a headwind for interest-rate sensitive small caps, which carry more floating-rate debt than their large-cap counterparts. Specifically, nearly a third of the debt among Russell 2000 constituents is floating rate. More recently, however, the macroeconomic backdrop has turned more favorable. Decelerating inflation, steady economic growth data, and the onset of interest rate easing cycles globally—including in the US—have begun to relieve pressure on small-cap balance sheets. Globally, small caps outperformed large caps in the third quarter. The MSCI World Small Cap Index delivered 9.3% in 3Q 2024, outpacing the MSCI World Index which delivered 6.1%.1
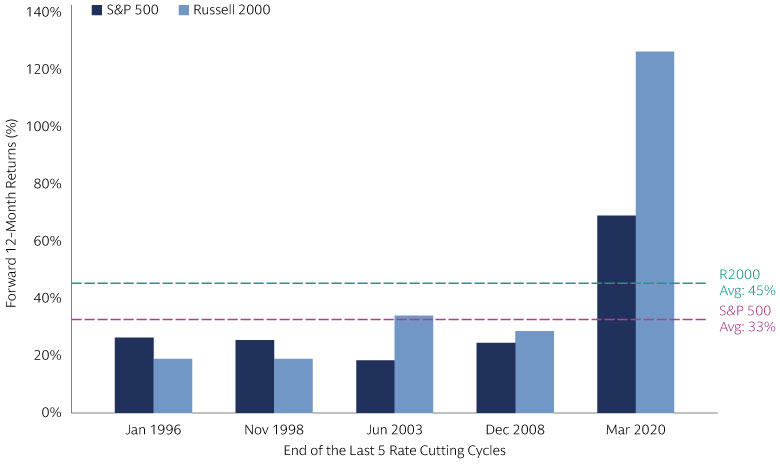
The US small cap market in particular saw a strong rebound this past summer—a development we had anticipated in our Mid-Year Investment Outlook. The Russell 2000 Index climbed 9.3% in 3Q 2024 versus 5.9% for the S&P 500 Index.2 Outperformance may continue given US small caps have outperformed large caps during post-inflationary peaks. Beyond the US, weaker economic growth and weaker currencies versus the US dollar contributed to more muted performance of non-US small caps. However, we expect small caps across regions to be among the net beneficiaries of rate-cutting cycles and growth-supportive central bank policy efforts. These dynamics should be favourable for margins in the near term, reducing the medium-term downside risk from interest expenses on floating rate debt, and enable smaller companies to fund long-term future business growth more affordably. A deterioration in economic growth still remains a risk for the small cap market—particularly in Europe where growth has been weaker in recent months—although downside growth risks could be cushioned by already low valuations relative to large caps.

Source: FactSet and Goldman Sachs Asset Management. As of September 30, 2024.
Valuation Disconnects
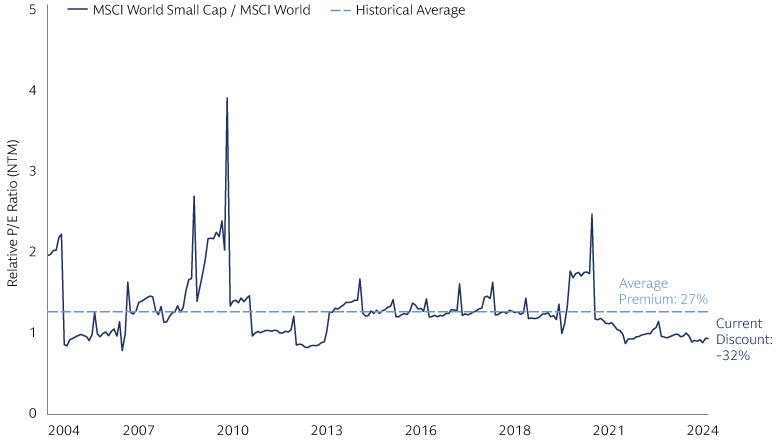
Alongside a supportive rate cutting environment, small caps have been more attractive lately from a valuation standpoint relative to larger names. When looking at the global universe of small caps, the relative P/E Ratio of the MSCI World Small Cap Index to the MSCI World Index currently trades at one of the largest discounts to its historical average, at -32%.3 Breaking out our analysis across regions, a similar story occurs in the US, where the median profitable stock in the Russell 2000 Index continues to trade well below its historical average relative to large caps despite a summer surge of investor interest in the asset class.4 Since 1985, the average discount that the median stock in the Russell 2000 Index has traded at is -2% relative to its counterpart in the S&P 500 index on a P/E basis, excluding unprofitable companies. Currently, the discount sits well below this average, at –28%.5 In Europe, small caps have become particularly cheap in the last five years: the valuation discount to European large caps during the period has averaged -1.8%; it’s currently less than -10%.6 Although regional nuances exist, the tailwinds for small caps from a valuations perspective are uniquely similar across the globe, paving the way for investors to find global opportunities for growth at cheaper prices.

Source: Bloomberg, MSCI and Goldman Sachs Asset Management. Monthly data as of September 30, 2024. Chart shows the P/E Ratio (NTM) of MSCI World Small Cap vs MSCI World over time, highlighting a current -32% discount vs. the 20Y Average, a -76% Discount vs. 2010 Peak and -62% Discount vs. 2021 Peak.
The combination of historically large valuation discounts in the small cap market and the supportive rate cutting environment creates opportunities for investors to add diversification to portfolios against a backdrop of US mega-cap concentration risk within the S&P 500. Meanwhile, there is significantly less concentration at the top of the small cap universe, with the top 10 stocks representing 4% of Russell 2000 vs 36% of S&P 500.7 In fact, the disproportionately large return attribution of the top large cap stocks to the index suggests that the remaining constituents may not be contributing their fair share of returns, a result of high concentration that small caps do not demonstrate. This paves the way for more opportunities within the small cap universe, as individual stock contributions to index gains are more distributed. The asset class also has a wider range of opportunities across sectors, as opposed to the tech-heavy large cap indices. Although earnings estimates vary widely, consensus seems to have emerged that small caps’ earnings growth for 2025 will exceed that of large caps. And with valuations at low levels, high-quality small caps with strong balance sheets and disruptive solutions may become prime targets for corporate M&A activity over the coming quarters, with deals potentially being done at premiums to prevailing share prices.
An Active Advantage - Fundamental and Quantitative Approaches
While macro and market indicators have turned supportive, we favor an active investment approach to capture small-cap alpha opportunities and navigate risk. Specifically, we favor small-cap companies with healthy balance sheets and relatively stable cash flows, while generally limiting unprofitable businesses (unless there is a clear path to profitability in the next one to two years, in our view). Selectivity within the small cap universe is paramount, given the need for risk management as some smaller companies may have weaker balance sheets or higher levels of floating rate debt. For example, investing in the median profitable Russell 2000 company each quarter since 2013 has provided annualized returns of 18.3%, relative to just 2.7% for the median unprofitable company.8 A focus on strong management teams and alignment with secular trends, such as digitization and demographics, can also help investors find durable business models.
Small caps stocks tend to be more obscure and less researched, providing greater inefficiencies for stock pickers to exploit. From a fundamental perspective, access to company management teams, including while companies are still private, can provide early opportunities to uncover hidden gems before they are broadly recognized by the market once they become public. Robust risk management is also key given small caps exhibit higher levels of volatility versus large caps due to lower liquidity and higher sensitivity to growth. From a quantitative perspective, wide information blackspots in the small cap universe encompass important opportunities to capitalize on insights that may not be captured with traditional approaches alone. We believe quantitative and systematic techniques, including the application of AI, can uncover differentiated investment opportunities by harvesting insights across vast amounts of data in the large and diverse small-cap market.
A Brighter Road Ahead
Inflation, rising rates and a focus on mega-cap leaders has proved challenging for small-cap equity performance in recent years, but after a memorable summer, we believe the tide is turning. Equity market opportunities are beginning to broaden, and we believe the case for complementing and diversifying large-cap allocations with small-cap exposure has strengthened given a compelling interest-rate backdrop and near-record valuation discounts. In our view, experienced investors with a strong track record able to utilize both fundamental and quantitative techniques look well-positioned to capture alpha, deliver differentiated returns and manage risk across a diverse market.
Learn more about our fundamental and quantitative approaches to public equity investing—from intense bottom-up research, to using advanced technology across a broad array of alternative big data sources.
1 Bloomberg and Goldman Sachs Asset Management. As of September 30, 2024.
2 FactSet and Goldman Sachs Asset Management. As of September 30, 2024. The economic and market forecasts presented herein are for informational purposes as of the date of this presentation. There can be no assurance that the forecasts will be achieved. Please see additional disclosures at the end of this presentation. Past performance does not predict future returns and does not guarantee future results, which may vary. There is no guarantee that objectives will be met.
3 Bloomberg, MSCI and Goldman Sachs Asset Management. Monthly data as of September 30, 2024.
4 Furey Research Partners, FactSet and Goldman Sachs Asset Management. As of September 30, 2024.
5 Furey Research Partners, FactSet and Goldman Sachs Asset Management. As of September 30, 2024.
6 Bloomberg, Goldman Sachs Asset Management. As of September 30, 2024.
7 FactSet and Goldman Sachs Asset Management. As of September 30, 2024.
8Bloomberg and Goldman Sachs Asset Management. As of September 25, 2024. The economic and market forecasts presented herein are for informational purposes as of the date of this presentation. There is no guarantee that objectives will be met. There can be no assurance that the forecasts will be achieved. Please see additional disclosures at the end of this presentation.
