Distribution Drought: The Quest for Liquidity in Private Markets
The record-breaking wave of exit activity of 2021 is difficult to put into context: annual private equity distributions oscillated at about 25% of NAV in the years prior to the pandemic, before spiking to 29% in 2021 at the same time that valuations were sharply on the rise; on an absolute basis, distributions eclipsed $700 billion in 2021—more than doubling the prior record.1 The ripple effects from this swell were felt for years, compounded by higher capital costs and a whipsaw in valuations. But while the initial pullback in distributions in 2022 and 2023 (falling to 12% and 10% of NAV, respectively) could be explained by the preceding wave, the ongoing distribution drought (at 9% of NAV in H1 2024) suggests something more than a cyclical slowdown.2
Today, recent vintage funds are distributing capital back more slowly than prior cohorts, while overall performance (as measured by total value-to-paid in capital (TVPI)) remains in line with historical norms. At the same time, exit valuations have dipped below holding valuations for the first time in at least a decade. Many commentators and analysts have assumed that these trends would lead to an increased focus on distributions-to-paid in capital (DPI), and while many LPs are scrutinizing it more closely, the vast majority continue to favor TVPI and internal rate of return (IRR) in evaluating track records; rather than replacing existing metrics, DPI has become another hurdle GPs must pass.3 While distributions have slowed, most LPs remain under-allocated to private market strategies and are therefore not looking for liquidity to ease excess allocation pressures, and many are in fact increasing their allocations. To that end, while distributions are integral for cashflow management and asset allocation, in the current environment they may perhaps be most important in helping to validate performance for mid-life funds. Indeed, it can be argued that many LPs today value distributions as much for their validation of current holding valuations as they do for liquidity.
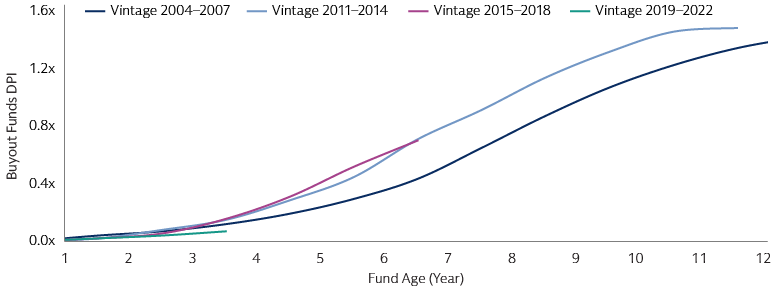
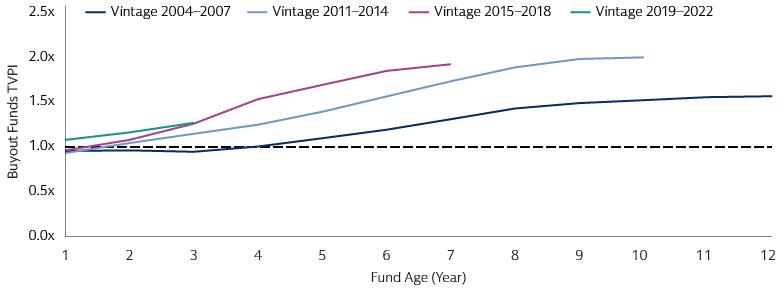
Source: Cambridge Associates, as of March 31, 2024. Data for global funds. DPI as aggregate distributions to LPs divided by aggregate contributions by LPs across time by each vintage. Market cash flow is set to start at fund age of 0.5 years, assuming fund launches in the same vintage are evenly distributed across the corresponding calendar year. Past performance is not indicative of future results.
Aggregate data suggests that operational headwinds may be a factor for some assets, but in general fundamentals remain intact, suggesting that distress has not been a major impediment to investment realizations.4 Higher rates and shifting valuations explain some of the disconnect, as well as the sluggishness in the IPO market, but we believe several structural factors are contributing to the slowdown in distributions, including the shifting nature of dealmaking and value creation strategies. Another important development is the increasing proclivity of GPs—and acceptance of LPs—to hold assets for longer, enabled by a proliferation of evolving fund structures and mid-stack capital solutions, which sit between debt and equity. While the distribution drought is being felt acutely today, we believe some of these developments will be long-lasting and have wide-ranging implications for how GPs approach investments at entrance and exit, as well as how LPs consider liquidity.
In Need of New Oases: Changes to the Exit Environment
Is bigger better? Implications of buy-and-build strategies
Dealmaking is a core aspect of private market strategies, and while M&A integrations are notoriously difficult, many GPs have made “buy-and-build” a cornerstone of their broader strategy. In the US, add-on deals have expanded from less than half to more than three-quarters of all leveraged buyouts during the post-GFC period.5 We have also seen the buy-and-build strategy gain traction in infrastructure, where asset owners have seen the benefits of scale in capital-intensive areas.
Not only has the total number of add-ons increased, but so has the propensity of platforms to engage in multiple add-ons. The size of platform companies has been further amplified by the steady increase in fund sizes, which necessitates larger equity checks to be efficiently deployed. As a result, while buy-and-build often results in scaled, strong-performing assets, the strategy can nevertheless lead to platform companies with a limited number of viable owners, and/or business models that are likely to be underappreciated or misunderstood in the public market. One common example is regional buy-and-builds of specialty healthcare practices, which do not fit cleanly in larger hospital systems, and often become too large for practitioners to acquire. In large-cap core infrastructure, the size of assets inherently limits the pool of potential acquirers. As the number of add-ons increases, other financial sponsors become an increasingly important exit route.
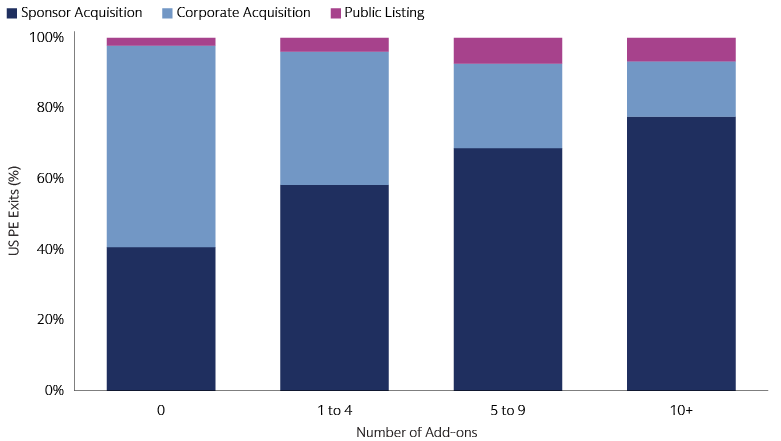
Source: PitchBook. Includes exits from 2014 to 2024. As of September 12, 2024.
Deeper reservoirs? Secondary buyouts to continuation vehicles
Secondary buyouts—wherein one GP sells an asset to another GP—were largely stigmatized through the initial decades of private equity. Much of the initial pushback came from LPs, with skepticism centered on the prospect of strong returns from an asset that had already been through private equity ownership. It wasn’t until the post-GFC era, when the financing and dealmaking landscapes shifted in numerous ways, that a meaningful market in secondary buyouts coalesced. As these deals proliferated, a variety of research, firsthand accounts, and anecdotal evidence has suggested returns from secondary buyouts are at least in line with those of other exit routes and deal sourcing methods.6 Indeed, after being destigmatized, secondary buyouts have become a key channel for exits and deal flow in the post-GFC era.
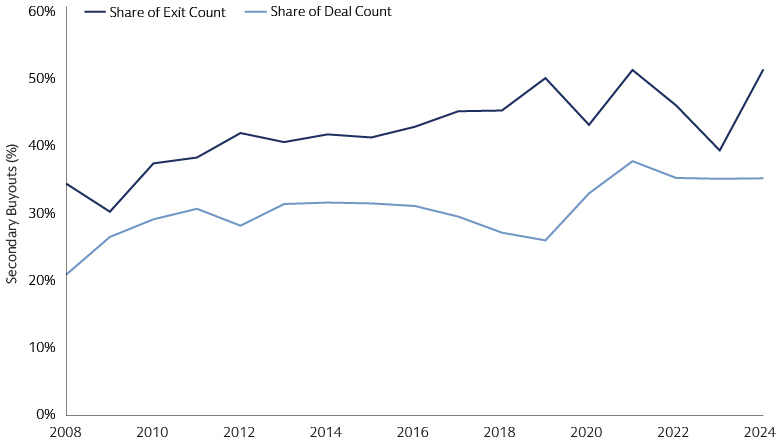
Source: PitchBook. As of June 30, 2024.
GPs were initially happy to have secondary buyouts open as a viable exit route, but there was often some sense of seller’s remorse—particularly as performance trended positively. Now as GPs seek to avoid selling to competitors, continuation vehicles (CVs) are primed to displace a significant share of SBO activity. CVs allow existing LPs the option to gain liquidity or maintain exposure to an asset, while the GP is able to continue holding and building their best assets beyond the initial hold period. The disruptions of the COVID pandemic increased adoption of CVs, and the structure has seen sustained usage as both supply and demand has increased. While an exit has traditionally been the final destination for private market investments, both LPs and GPs alike are increasingly embracing CVs and other intermittent liquidity solutions as a standard part of private markets.
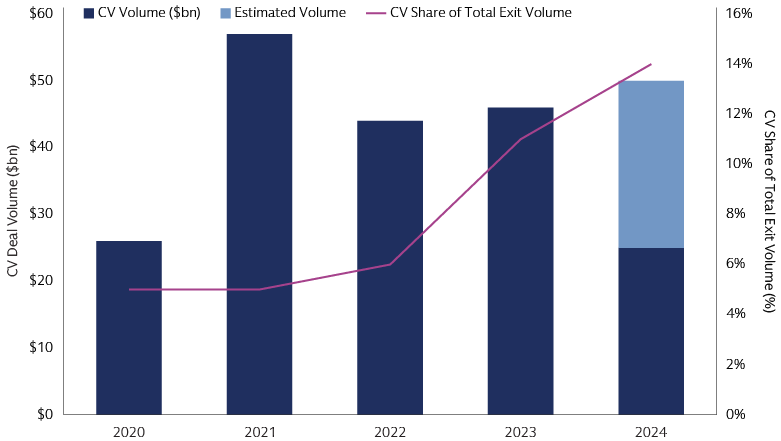
Source: Jefferies H1 2024 Global Secondary Market Review. As of June 30, 2024.
Just a pitstop: intermittent liquidity
Some methods of achieving intermittent liquidity have been well-established and tend to ebb and flow with developments in broader capital markets. Dividend recaps, for example, hit a record in 2021 when full exits were at a record level, but are also primed to reach record levels again this year when full exits have waned.7 Expansion in private credit has also led to increased access to mid-stack capital solutions, such as preferred equity, which can be customized with features of both debt and equity securities to best meet the needs of borrowers in complex situations, including acquisition financing and recapitalizations. The precise mix between debt/equity will depend on the asset, including its cashflow profile and existing capital structure and balance sheet, with features such as payment-in-kind (PIK) providing additional flexibility. For investors pursuing intermittent liquidity, a key question will be if current liquidity is being generated in a way that reduces future distribution potential and/or the ability for the asset to perform well going forward. To that end, investors should strive to understand how and why intermittent liquidity is being pursued, including whether a full exit was explored.
Untapped Potential
Potential exit routes have always been considered as part of the initial investment thesis by prudent GPs, but these considerations are becoming even more important. Operating plans have become a standard part of the buyout playbook, and increasingly the exit strategy is an important variable in informing the operational strategy. So-called “dual-track” exit strategies, whereby GPs would simultaneously explore exit via acquisition and IPO, became increasingly common in the late-2010s after confidentially filing for an IPO became allowed in the US. But merely having exit optionality is not enough; GPs need to focus on deliberately acquiring and building assets that can be turned into something that someone else would want to own—whether that is a strategic acquiror, financial sponsor, or public equity investor—and the type of potential buyer matters. Strategic acquirers are often seeking straightforward assets that can more easily be integrated, presenting a potential challenge for portfolio companies with expansive geographic footprints or multiple distinct business lines. Similarly, public equity investors are known to apply a “conglomerate discount” for large companies with disparate operations (which is one reason why carveouts and divestitures have been on the rise). For certain assets—such as those with ambitious growth plans or multi-part buy-and-build strategy—the best answer may be to structure the initial funds and transactions to allow for flexibility in seeking intermittent liquidity and longer hold times.
For LPs, it is important to remember that GPs are often considering liquidity across the entire fund—and potentially a series of funds—which can influence the decision-making process for individual assets. Other factors such as fund economics, carry treatment, and personal recognition can also play a role in how a GP chooses to approach liquidity. Understanding these dynamics can help LPs to better understand the motivations behind specific transactions.
Longer hold times are partly a symptom of the current market environment, but certain factors are likely to keep the trend intact going forward. Larger fund sizes have led to larger deal sizes—both at acquisition and through buy-and-build strategies—leading to a reduced potential buyer universe and more reliance on the IPO market. In many cases, middle-market companies may be better-positioned to exit given a deeper pool of both potential strategic acquirers and financial sponsors.
Private market strategies are inherently illiquid, but innovations continue to change the paradigm. Semi-liquid fund structures and CVs are expanding optionality, both in longer hold periods for GPs and enhanced liquidity options for LPs. These innovations have opened new avenues to allow for indefinite hold periods. As part of this development, we have already seen—and expect to continue to see—increased demand for “mid-stack” capital solutions that provide existing owners with intermittent liquidity alongside additional capital investment to support continued growth.
1Burgiss. As of Q2 2024.
2Burgiss. As of Q2 2024.
3Goldman Sachs Asset Management Alternatives Diagnostic Survey 2024. As of October 22, 2024.
4Burgiss As of Q2 2024.
5PitchBook. As of Q2 2024.
6Kick, Jonas and Schwetzler, Bernhard, Second Hand or Second Generation? -The Performance of Secondary Buyouts (August 26, 2021). Available at SSRN: https://ssrn.com/abstract=4099376; Eschenröder, Tjark, Secondary Buyout Performance (September 19, 2019). Available at SSRN: https://ssrn.com/abstract=3456630
7PitchBook LCD. As of September 24, 2024