An Investor’s Guide to Europe’s Fast-Growing Active ETF Market

Key Takeaways
Europe’s exchange-traded fund (ETF) market is evolving. For years, ETFs in the region meant one thing: passive products that track an index. Now many investors are demanding more from ETFs. They are increasingly seeking out products that combine the benefits of active management, such as alpha potential and risk management, with the transparency and ease of trading that come with the ETF wrapper.1
This shift has driven a rapid expansion of actively managed ETFs in Europe, with assets under management growing at a 40% annual rate over the past five years.2 Net inflows to active ETFs accounted for nearly 7% of total ETF flows in the first seven months of 2025, up from just over 1% in 2020.3 The strength of investor demand has encouraged fund providers to bring a range of new products to market, and this trend has accelerated in 2025, with the number of active ETF launches outpacing passive launches for the first time.4
Active ETFs debuted in Europe in 2011, three years after the first-ever active ETF launch in the US,5 and in some ways their development has followed the path laid down by the US market. Passive funds remain dominant in both markets, but growth is increasingly driven by active ETFs. Product innovations that first took off stateside, such as solutions-based ETFs aiming to deliver consistent income or downside protection, are now starting to emerge across the Atlantic.
In other ways, the evolution of ETFs in Europe has been shaped by the unique structure of its capital markets, which span the 27-nation European Union and the financial centers of Switzerland and the UK. The preferences of European investors have also played a role. For example, investors in Europe have tended to treat active ETFs as investments to buy and hold, and this has implications for the types of funds they select. With the scale and range of opportunities in Europe’s active ETF market growing fast, we think investors need a clear understanding of how this market works and where it is headed.
Active ETFs Are on the Rise
Active ETFs are managed by investment professionals with the goal of achieving specific outcomes such as outperforming a benchmark, generating income, or targeting a specific investment theme. They also provide the advantages that come with the ETF wrapper, which typically include intraday trading at a known price, enhanced transparency on holdings, and cost-effectiveness. This combination can make active ETFs an efficient portfolio-construction tool for boosting diversification, managing risk, and gaining market access. In periods of heightened market uncertainty, these attributes may help strengthen portfolio resilience.
The growth of assets under management in Europe’s active ETFs has accelerated in recent years, powered by rising demand. Since assets broke through the €10 billion threshold in the first half of 2019, they have increased nearly sevenfold to €68.6 billion.6 The number of funds and providers has followed a similar trajectory, with active launches accounting for 54% of all new ETFs brought to market so far this year.7
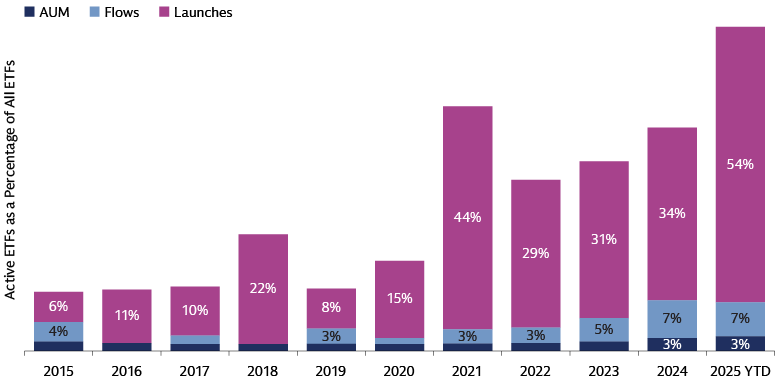
Source: Morningstar, Goldman Sachs Asset Management. As of July 31, 2025.
In terms of assets and launches, Europe has now reached levels seen in the US five years ago, when active ETFs in the US accounted for 3.4% of total ETF assets and 56% of launches.8 Can European active ETFs maintain this momentum in the years ahead? The signs are encouraging, in our view, with the pool of investors widening. In a recent survey of ETF investors, more than a fifth of European respondents said they planned a significant increase (25% or more) in their exposure to active ETFs, while 60% planned a moderate increase (10% to 24%).9 In response, the number of asset managers offering active ETFs in Europe has surged to 93.10 With this strong backing from investors and fund providers, we think active ETFs are poised for continued strong growth in the region.
How Investors Use European Active ETFs
The investor base for European active ETFs is expanding, with Asian investors increasingly joining those in Europe to help drive market growth. In our experience, investors in both regions tend to use these funds as core building blocks in a buy-and-hold allocation. They are just starting to use active ETFs as financial instruments for risk management and in hedging and arbitrage strategies, whereas in the US this practice is well established alongside more traditional core equity and bond allocations.
These preferences are reflected in the types of funds that attract the greatest demand. In Europe, the largest net inflows in the first seven months of 2025 went into equities, led by global and large-cap blend equity funds.11 Within equities, the use of active ETFs in core allocations helps explain the prevalence of enhanced indexing strategies that seek to outperform a benchmark while limiting tracking error.
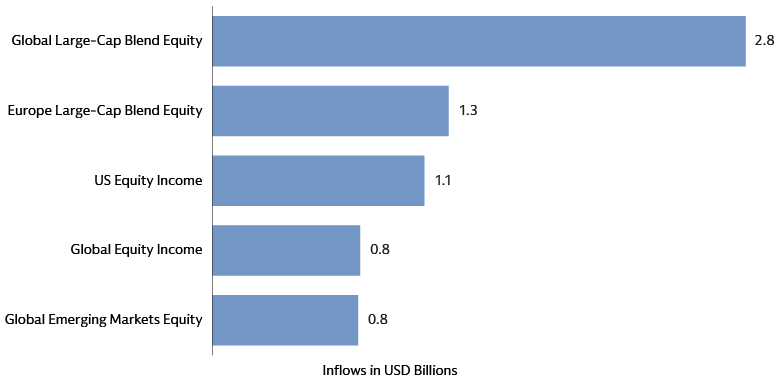
Source: Morningstar, Goldman Sachs Asset Management. As of July 31, 2025.
By contrast, the greatest demand in the US was for derivative-income funds, which are designed to generate income from a portfolio of assets with the use of options contracts. The top five US fund categories also include ultra-short duration bonds, which are less sensitive to interest rates than longer-duration portfolios.12
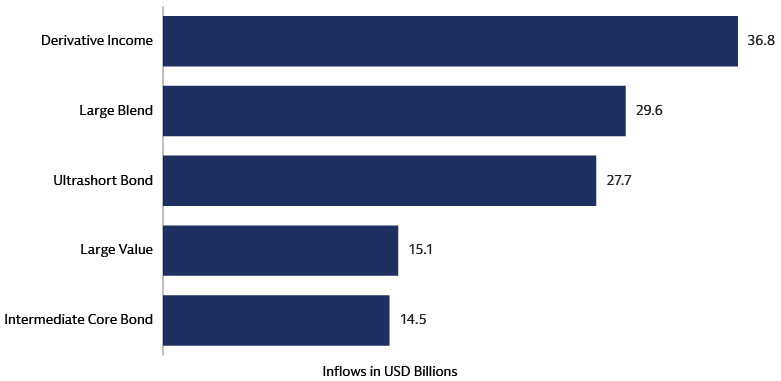
Source: Morningstar, Goldman Sachs Asset Management. As of July 31, 2025.
As the European market develops, we believe investors will gradually embrace use cases now prominent in the US. These include using active ETFs to access harder-to-reach and emerging parts of the market, such as ultra-short-duration bonds. We also see growth potential for ETFs that offer exposure to asset classes that are still new to the European market, including collateralized loan obligations (CLOs), a market previously dominated by institutional investors that may offer competitive yields and diversification benefits. We expect to see increasing demand for solutions-oriented ETFs including buffer funds, an actively managed options-based strategy that seeks to deliver a pre-defined outcome over a set period. Finally, we expect European providers of model portfolios to follow their US counterparts in increasing their use of active ETFs.13
Navigating Europe's Diverse ETF Market
The ability to buy and sell ETFs like stocks, on an exchange at the prevailing market price, is one of the prime benefits these funds offer to investors. The unique two-sided mechanism (primary and secondary markets) that supports this trading is the same everywhere, and functions efficiently in Europe, just as it does in the US and other markets. Yet there are regional nuances that investors in European ETFs should be aware of.
For a start, the European securities market is more complex than its US counterpart because of the number of countries, currencies and exchanges involved. US ETFs are all registered in a single country, denominated in a single currency, the US dollar, and listed on a handful of exchanges, including the New York Stock Exchange and Nasdaq. This market structure provides the benefit of consolidated pre-trade transparency and can therefore contribute to the prevention of potential pricing inefficiencies rising from fragmentation.
By contrast, Europe is home to more than 30 major stock exchanges, of which the largest are Euronext and the London Stock Exchange. In addition to the major currencies – the euro, the pound sterling and the Swiss franc – Europe has a variety of other national currencies. This securities-market fragmentation contributes to the listing of ETFs on multiple exchanges and in multiple currencies. The distribution of European ETF trading across venue types also differs from the US. In Europe, 28% of ETF trading occurs on traditional “lit” exchanges, which display buy and sell orders as well as prices before a trade occurs. The remaining 72% happens off-exchange, either on venues such as request-for-quote (RFQ) platforms14 and systematic internalizers,15 or directly between investors.16 In the US, by contrast, 53% of ETF trading occurs on lit exchanges, with the remainder off-exchange.17 The distribution of trading can shift over time.
The structure of Europe’s securities market has implications for all investors, including those who trade in ETFs. When securities are listed on multiple exchanges, turnover is dispersed, making it harder to gauge total trading volumes. The visibility of ETF liquidity is further reduced by the prevalence of off-exchange trading, which is not reflected in exchange turnover data. As a result, the total traded volume of a fund, as well as the best price available – especially for larger transactions – may not be reflected in the data available on exchanges. Yet investors should keep in mind that the liquidity of an ETF depends less on total traded volume than on two key factors: the liquidity of its underlying assets and the efficiency of the creation-and-redemption mechanism between the ETF provider and its APs.
EU policy makers are responding with initiatives intended to increase the consolidation of its securities markets. The European Commission plans to create a single, centralized data feed – known as a consolidated tape – of prices and trading volumes from execution venues across the bloc.18 The consolidated tape will allow investors to make more informed decisions, enhance competition between venues, and help integrate EU financial markets, according to the commission. Firms are also taking steps to improve market efficiency. For example, Euronext has announced plans to consolidate the settlement of equity trades on the exchanges it operates in six European financial centers in a bid to increase efficiency and resilience.19
Europe's Evolving Regulatory Landscape
Europe’s active ETF market never had a defining moment when the rules of the game changed, and rapid expansion followed. This sets it apart from the US, where in 2019 the Securities and Exchange Commission streamlined the process for bringing new ETFs to market and allowed for the use of custom baskets of assets, a crucial change that facilitated the development of active ETFs.20 Instead, the European market is governed by many of the same rules as mutual funds, creating a regulatory environment that will be familiar to the majority of investors in the region.
The main piece of the regulatory framework for ETFs in Europe is known as UCITS, the acronym for Undertakings for Collective Investment in Transferable Securities. The UCITS regulation was first adopted 30 years ago to promote investor protection and provide a single set of rules for investment funds in the EU. Thanks to UCITS, funds registered in any of the EU’s member states can be passported for marketing across the European Economic Area.21 Ireland’s ETF administrative ecosystem has allowed the country to emerge as the dominant ETF domicile with 72% market share. Luxembourg, the EU’s largest hub for UCITS funds overall,22 ranks second in ETF registrations with 17%.23
Within the EU framework, national regulators have some leeway (margin of appreciation) to make additional rules. Investors should be aware of potential national differences in regulations, especially in the main ETF domiciles, Ireland and Luxembourg. One area of recent activity focuses on “semi-transparent” active ETFs. These funds are not required to disclose their full holdings daily; instead, they are permitted to publish their portfolios less frequently, which allows active ETF managers to keep their holdings hidden from competitors for longer periods of time.24 The fund regulators in Ireland and Luxembourg recently changed their rules to allow semi-transparent active ETFs.25
A Market Poised for Continued Growth
The expansion of active ETFs in Europe has accelerated in recent years, with new issuers entering the market in response to strong investor demand. Looking forward, we expect this trend to continue, driven in part by investor interest in a broadening range of funds, including solutions-based ETFs that can be used to access new markets and help manage portfolio risk. While ETF providers have tended to focus on institutional investors in Europe, they are increasingly seeking to engage with the retail market, potentially enlarging the investor base for active ETFs and driving further growth. With nine out of 10 European respondents in a recent survey planning to increase their exposure to active ETFs in the year ahead,26 we expect further market growth in the region.
1For example, 22% of European respondents in a recent survey of ETF investors said they planned to “significantly” increase their exposure (by 25% or more) to active ETFs, while 60% planned a moderate increase (10% to 24%). See “Global ETF Investor Survey,” Brown Brothers Harriman. As of March 24, 2025.
2Morningstar. As of July 31, 2025. Reference is to the compound annual growth rate.
3Morningstar. As of July 31, 2025.
4Morningstar. As of July 31, 2025. In the first seven months of 2025, active ETFs accounted for 54% of European launches, outpacing passive ETFs at 46%.
5On the launch of the world’s first active ETF in the US, see “Bear Stearns Begins Trading of First Actively Managed ETF,” Global Custodian. As of March 25, 2008. Pimco launched the first European active ETF in 2011. See “Active ETFs Are No Easy Win for Mutual Fund Managers,” ETF Stream. As of March 27, 2025.
6Morningstar. As of July 31, 2025. On that date, US active ETF AUM stood at just under $1.2 trillion, the equivalent of €1 trillion.
7Morningstar. As of July 31, 2025.
8Morningstar. As of June 30, 2025.
9“Global ETF Investor Survey,” Brown Brothers Harriman. As of March 24, 2025.
10Morningstar. As of September 9, 2025.
11Morningstar. As of July 31, 2025. The discussion in this paragraph refers to Morningstar Category fund classifications. Global large-cap blend equity funds “invest primarily in the equities of large-cap companies from around the globe. Most of these funds divide their assets among many developed markets and invest at least 20% of equity assets in North America and 15% in Greater Europe.” For definition, see the glossary on Morningstar’s website. As of August 28, 2025.
12Ibid. Derivative-income funds “largely rely on options contracts to generate incremental income on top of traditional equity market return drivers.” Ultra-short bond funds “invest primarily in investment-grade U.S. fixed-income issues and have durations of less than one year (or, if duration is unavailable, average effective maturities of less than one year). This category can include corporate or government ultrashort bond portfolios, but it excludes international, convertible, multisector, and high-yield bond portfolios. Due to their focus on bonds with very short durations, these portfolios offer minimal interest-rate sensitivity and therefore low risk and total return potential.” See Morningstar Office. As of August 28, 2025.
13As of March 31, 2025, 44% of US model portfolios included at least one active ETF. See “2025 US Model Portfolio Landscape,” Morningstar. As of June 2025.
14A request-for-quote platform such as Bloomberg and Tradeweb allows buyers to request price quotes for products such as ETFs from potential sellers.
15The term “systematic internalizer” was introduced in the European Union’s Markets in Financial Instruments Directive. The law defines the term as “investment firms which, on an organized, frequent, systematic and substantial basis, deal on own account when executing client orders outside a regulated market, an MTF or an OTF.” MTF refers to a multilateral trading facility, while OTF stands for organized trading facility. See “Article 4 Definitions,” European Securities and Markets Authority website. As of September 12, 2025.
16Bloomberg Intelligence. Data as of June 30, 2025.
17Bloomberg. Year-to-date data as of September 4, 2025.
18“Commission Advances Work Towards a Consolidated EU Trading Landscape for Financial Instruments,” European Commission. As of June 12, 2025. The EU’s chief financial markets regulator intends to select a consolidated-tape provider for shares and ETFs by the end of this year. See “ESMA Launches Selection of Consolidated Tape Provider for Shares and ETFs,” ESMA. As of June 20, 2025. The US has had a form of consolidated tape since the 1970s.
19“Euronext Consolidates Settlement on Its Markets to Improve European Capital Markets’ Competitiveness,” Euronext. As of March 12, 2025.
20 “SEC Adopts New Rule to Modernize Regulation of Exchange Traded Funds,” SEC press release. As of September 26, 2019.
21The European Economic Area consists of the 27 EU member states plus Iceland, Liechtenstein and Norway.
22“Countries Where Luxembourg Funds Are Registered for Sale,” Association of the Luxembourg Fund Industry website. As of September 12, 2025.
23Morningstar. As of July 31, 2025. Following Ireland and Luxembourg, the list of the largest ETF domiciles in Europe by total net assets continues as follows in descending order: Germany (4.1%), Switzerland (2.6%), France (2.4%) and Jersey (1.3%).
24The US SEC first approved semi-transparent active ETFs in late 2019, and the first launches came the next year, though there has been limited take-up in the market. On SEC approval, see “SEC Officially Signs Off on New Wave of Semi-Transparent ETFs,” ETF Trends. As of December 11, 2019.
25On the decision by Luxembourg's fund regulator, see “European Approval for Semi-transparent ETFs Sparks Debate,” Financial Times. As of March 10, 2025. On the Irish decision, see “UCITS Questions and Answers, 42nd Edition,” Central Bank of Ireland. As of April 17, 2025.
26“Global ETF Investor Survey,” Brown Brothers Harriman. As of March 24, 2025.
