Market Know-How 4Q 2026: Yield Ahead




Key Takeaways
Yield Ahead
The era of central bank yield suppression appears to be firmly behind us. After more than a decade of zero rates, quantitative easing, and yield curve control, we believe the bond market has reclaimed its traditional role as the ultimate arbiter of pricing — setting yields and, in turn, encouraging greater fiscal discipline among sovereign issuers. We believe this marks a genuine regime change rather than a cyclical blip, with implications that will reverberate across every asset class.
While inflation expectations remain well-anchored for now, G10 yields continue to face pressure from resilient growth, energy market volatility, and a significant AI-driven borrowing cycle. In our view, these structural forces are unlikely to subside anytime soon, raising two critical questions: how high can yields go, and what are the implications for equity markets?
This edition of Market Know-How explores how this environment is reshaping global portfolios and where we see potential opportunities emerging in:
Fixed Income: EM debt as a source of uncorrelated carry relative to Developed Market yields.
Public Equities: Economic security equities to gain exposure to the next capex cycle.
Alternatives: Liquid alts as a tool for diversification amidst market volatility.
Short-Term Macro Themes
We expect economic resilience to persist, even as policymakers navigate complex "HEAT" risks to inflation. At the same time, a deluge of AI infrastructure debt issuance and a dense global election calendar may keep sovereign bond yields elevated.
Growth: Defying the Odds
- Despite recent energy price shocks, developed market economies have proven remarkably resilient — underpinned by three key forces: supportive fiscal policy, the ongoing AI boom, and durable labor markets.
- Fiscal policy has turned more expansionary on both sides of the Atlantic. In Europe, Germany's rapid fiscal expansion is set to widen its deficit from 3% of GDP last year to nearly 4% in 2026, fueling a rebound in domestic manufacturing.1 In the US, the "One Big Beautiful Bill" has extended income tax cuts and introduced targeted credits, putting more cash in workers' pockets while spurring domestic investment and manufacturing activity.2
- The AI-led investment cycle remains a powerful growth engine. It continues to drive massive capex into infrastructure and data centers, while a strong wealth effect from surging equity valuations underpins robust consumer spending.
- Labor markets, meanwhile, have stabilized alongside the improving macro backdrop, reinforcing consumer confidence and supporting sustained economic activity.
- Together, these forces continue to insulate developed markets from broader global volatility. Our monthly activity indicator shows G4 growth currently tracking at 2% — comfortably above trend — and we expect this strength to persist into year-end.
Inflation: Feeling the HEAT
- We expect developed market central banks to deliver a shallow hiking cycle, raising rates modestly over the coming months before entering a prolonged pause. While the global economy has proven remarkably resilient, policymakers must now navigate a complex web of supply shocks we call the "HEAT" factors: Harvests, Energy, AI, and Trade.
- Geopolitical tensions and extreme weather events continue to disrupt agricultural and energy markets, putting sustained upward pressure on goods and services prices globally. At the same time, the rapid scale-up of artificial intelligence is straining electricity grids and driving up power costs, while semiconductor supply constraints keep chip prices and the manufacturing cost of consumer electronics elevated.
- These pressures are structural, not transitory. We project inflation will stay above 3% across most developed markets in the near term, delaying a return to target until at least 2028. Central banks cannot directly resolve issues like climate change or geopolitical fragmentation, but they can act to contain second-round effects and prevent price pressures from broadening.
- Against this backdrop, we expect 1 to 2 additional rate hikes from major central banks by year-end. We project policy rates to reach: 2.75-3.00% for the ECB, 4.25-4.50% (upper bound) for the Fed, 4.00-4.25% for the BoE, and 1.50%-1.75% for the BoJ.
Financing the AI Revolution
- Intensifying competition for capital — driven by massive debt issuance from US hyperscalers — is a key force keeping interest rates elevated. This year, our Research division estimates that these tech giants have raised about $400 billion in the US IG corporate debt market, accounting for roughly 20% of gross issuance3 Because AI-related bonds typically carry maturities three to four years longer than the broader US IG index, this heavy supply is placing pronounced upward pressure on the long end of the curve, keeping yields elevated.
- We expect this capex boom to expand further. AI hyperscaler capital expenditure in the US currently stands at an estimated 1.8% of GDP but could plausibly climb to a range of 2.5%-3.5%.4 This trajectory closely mirrors the peak investment impulses of past transformative eras — from the 1990s internet boom to the 19th-century railroad revolution.
A Packed Electoral Calendar
- Fiscal policy uncertainty related to an upcoming series of elections is, in our view, one of several factors that may be contributing to elevated bond yields. From now through the end of 2027, more than 40% of the world's population and about 50% of global GDP are scheduled to participate in national elections.5
- Europe faces an exceptionally dense 2027 electoral calendar, with nine EU member statesincluding three of the four largest EU economies France, Italy, and Spain, voting before the end of September. Meanwhile, the U.S. mid-term elections on November 3rd this year introduce further uncertainty, even though polls suggest a legislative gridlock with Democrats reclaiming the House.6 This concentration of political risk makes fiscal guidance and government formation critical market variables.
- While historical data shows that election-year fiscal slippage is typically modest, with structural primary balances weakening by an average of just 0.25% of GDP,7 elections generate near-term noise rather than structural regime shifts. The primary fiscal risk stems not from pre-election spending sprees, but from the potential for fragmented parliaments. Historically, such outcomes lead to policy uncertainty, government instability, and delayed fiscal consolidation. Consequently, we view political gridlock, rather than expansionary giveaways, as the defining risk of the 2027 cycle.8
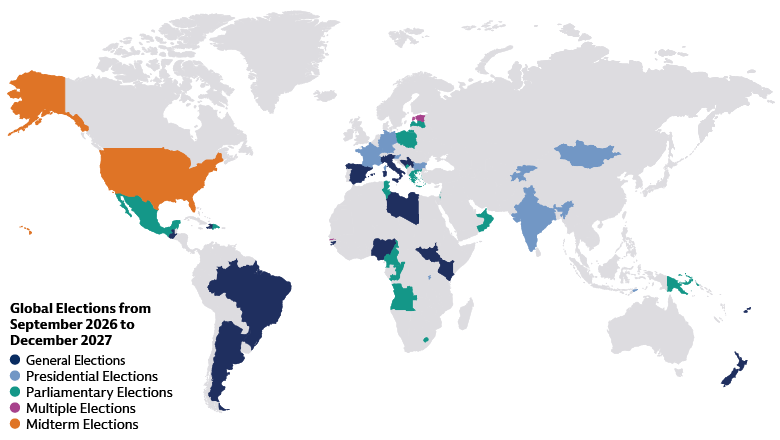
Source: ElectionGuide, Wikipedia 2026 and 2027 National Electoral Calendar and Goldman Sachs Asset Management. As of October 1, 2026. Elections shown include national elections and referenda scheduled between October 2026 and December 2027. Election dates and types were compiled from ElectionGuide and publicly available national electoral calendars, with Goldman Sachs Asset Management analysis, based on information available as of October 1, 2026. Election dates and classifications are subject to change.
Long-Term Macro Themes
While the recent rise in long-term yields has largely been driven by upward revisions to real rate expectations, we believe several structural forces point to a persistently positive and rising term premium as the more important driver of yield levels and volatility going forward.
CHANGE
Climate transition – High level of debt – Aging demographics – New finance – Global fragmentation – Evolving technology
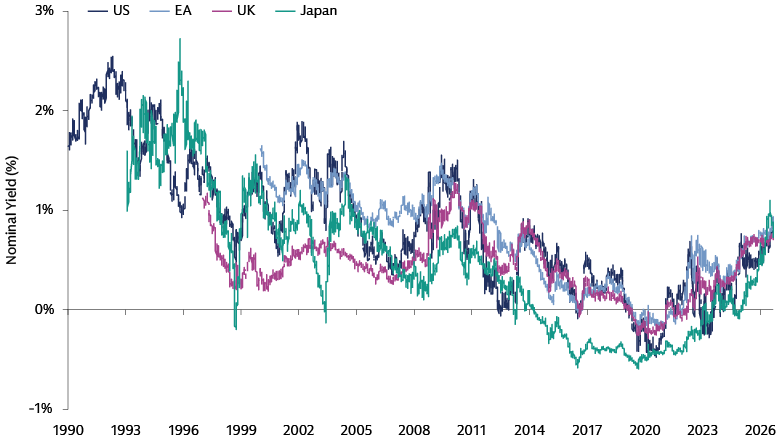
Source: Goldman Sachs Research and Goldman Sachs Asset Management. As of October 1, 2026. Term premium estimates represent the compensation investors require for holding longer-maturity government bonds beyond the expected path of short-term interest rates. Estimates are based on Goldman Sachs Global Investment Research analysis and are subject to model and data assumptions.
- Fiscal policy may play an increasingly important role in driving yields going forward. Governments have inherited historically elevated debt burdens, compounded by structural spending needs across defense, AI infrastructure, and economic resilience. We believe this expands the supply of government debt at precisely the moment official-sector demand is declining, a combination that supports structurally higher long-end yields.
- A more fragmented geopolitical backdrop is compounding this dynamic. Heightened geopolitical risk and a push toward nationalism are increasing the frequency of supply-side shocks to energy, trade, and critical inputs, raising the probability of inflation surprises for which investors will increasingly demand compensation.
- At the same time, reduced forward guidance from the Fed has, in our view, added further uncertainty around the future policy path, at least in the US. Given that developed market yields tend to take their cue from the US, this may have broader implications for G4 bond markets.
- Finally, as central banks normalize their balance sheets, private investors — who are more sensitive to valuations and relative returns than the relatively price-insensitive buyers of the quantitative easing era — are absorbing a growing share of net issuance, which we believe structurally raises the yield required to clear the market.
- For investors, we see several practical implications. Duration risk warrants closer active management, as term premium-driven moves are likely to be less predictable than in the prior decade. We also see a stronger case for diversified curve positioning and a larger role for inflation-protection strategies within fixed income allocations, as episodic, supply-driven volatility becomes a more persistent feature of the rates landscape.
Market Themes
Our base case remains a reflationary backdrop, led by resilient growth and continued AI momentum, despite higher interest rates. While we remain constructive on risk assets in the medium term given strong fundamentals, potential opportunities in the short term are fewer and risks have increased. Tensions in the Middle East persist, inflation risks have increased, a number of key elections are fast approaching and fiscal concerns continue to put upward pressure on bond yields.
Base Case
Our central scenario assumes Middle East energy flows normalize toward pre-war levels over the coming months, easing supply-side price pressure. Global growth stays resilient as inflation slowly returns to target, allowing central banks to tighten only modestly. Continued AI-driven investment and productivity gains support earnings and risk appetite, underpinning a constructive backdrop for risk assets.
Key Implications
We maintain high conviction in EM equities on the back of sustained AI capex, but pivot from mega-cap hyperscalers toward US Small Caps to keep exposure to accelerating US growth while having a more diversified exposure in portfolios. In fixed income, yield curves remain under pressure from both ends: cautious central banks are anchoring the front-end, while loose fiscal policy and solid growth keep long-end yields elevated. In that context, we expect EM debt to stand out given attractive yields and a stabilizing risk profile amid elevated fiscal and monetary concerns and rising AI issuance. Within alternatives, we believe increasing exposure to Hedge Funds alongside Private Credit may help mitigate drawdown risk as equity and bond volatility rise in tandem.
Inflation Re-acceleration
In this scenario, energy-crisis spillovers prove larger than expected, pushing inflation higher for longer, forcing central banks to tighten aggressively. Global growth weakens under tighter financial conditions. This stagflationary-leaning environment pressures risk sentiment, with real yields rising and growth-sensitive assets underperforming.
Key Implications
Traditional hedges lose their edge as inflation stays elevated, growth slows, and rates rise, exposing portfolios to further drawdowns. In this environment, we would favor short-duration fixed income to reduce interest rate sensitivity, alongside high-dividend equities for their carry characteristics. Within risk assets, credit may absorb the shock better than equities, supported by its income component. We believe that the monetary policy response proves global in nature, short-duration equity markets such as Europe are likely to outperform. In rates, yield curves may bear-flatten further, with front-end yields rising more than the long end as inflation risk reprices higher.

Rapid Disinflation
This benign scenario envisions energy supply increasing faster than expected, allowing inflation to normalize quickly. Global financial conditions ease substantially as central banks pivot toward accommodation sooner than markets price. This backdrop broadly supports duration-sensitive and growth assets as falling rates lift valuations.
Key Implications
Renewed dollar weakness tilts the playing field toward global ex-US equities and small caps. Core fixed income also benefits as rate pressure eases. Yield curves bull-steepen; the front-end rallies on inflation relief, but the long-end holds up, anchored by fiscal expansion and above-trend growth.
Asset Classes
EM Debt
Carry Beyond the Yield
EM debt’s starting yield may be viewed as a cushion against higher rates. Rather than asking whether UST yields will rise or fall, investors can ask how much of a Treasury sell-off the income cushion can absorb before duration turns total return negative. Our analysis identifies this breakeven threshold, making the trade-off between carry and rate risk explicit. We believe stronger EM monetary and fiscal frameworks, healthier external balances and lower sensitivity to UST yields have improved the asset class’ resilience to external shocks. This shifts the allocation decision from a directional rates call to a question of absorption: how much volatility is an investor being paid to tolerate? In a regime of elevated term premium and policy uncertainty, attractive carry can provide a margin for error.
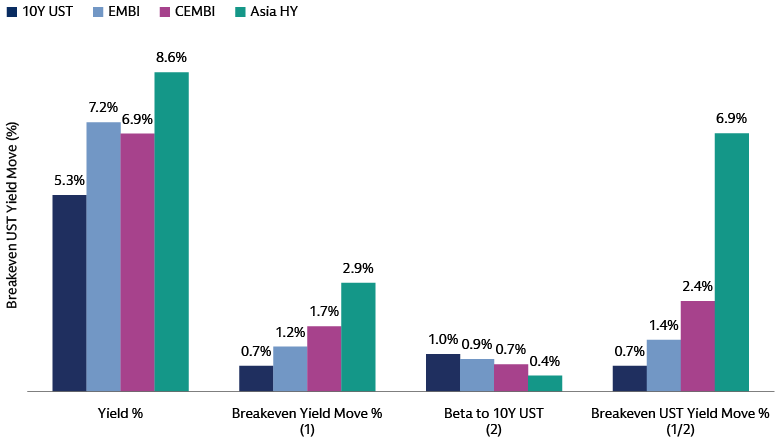
Source: Macrobond and Goldman Sachs Asset Management. As of October 1, 2026. Data are sourced from Macrobond and cover the ICE BofA 10-Year US Treasury Index, ICE BofA Asia High Yield Corporate Constrained Index, J.P. Morgan EMBI Global Diversified Index and J.P. Morgan CEMBI Broad Diversified Index. Breakeven yield move is calculated as index yield divided by modified duration or duration to worst, as applicable. Beta to the 10-year US Treasury yield is estimated using monthly observations from September 2014. Breakeven UST yield move is calculated as the breakeven yield move divided by the estimated beta.
Economic Security Equities
The Next Capex Cycle
Geopolitical tensions are adding upside pressure on inflation while weighing on growth, creating a more uneven and shifting macro backdrop. This divergence matters for fixed income, as stagflationary and recessionary tail scenarios require very different duration positioning, with different maturities outperforming in different regimes. At the same time, elevated volatility, shifting policy expectations and widening cross-country dispersion reduce the effectiveness of static benchmark allocations. We believe unconstrained bond strategies that can actively adjust duration, sector, and/or regional exposure are well poised to navigate the current uncertainty and capture opportunities across changing market conditions.
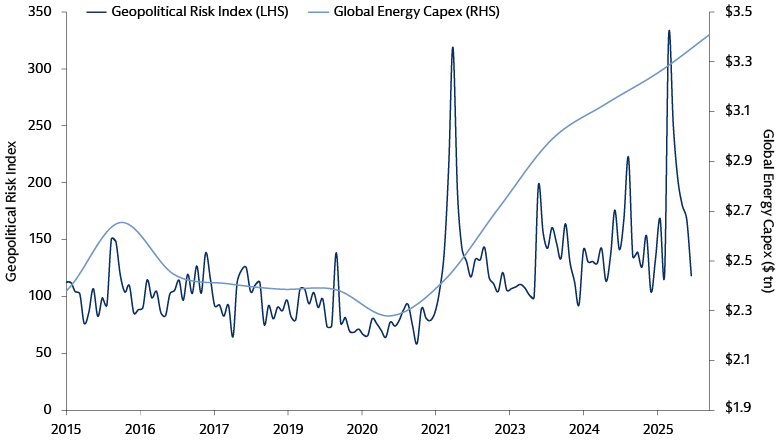
Source: IEA, Caldara, Dario and Matteo Iacoviello and Goldman Sachs Asset Management. As of October 1, 2026. Geopolitical risk is measured using the Caldara-Iacoviello Global Geopolitical Risk Index. Global energy investment data are sourced from the International Energy Agency and aggregate capital expenditure across energy supply, power generation, electricity networks and storage, and end-use electrification. The IEA measures investment as capital spending on energy assets and reports historical investment series in real US dollar terms.
Liquid Alternatives
Diversification in Motion
Diversification should be judged by what happens when the portfolio is under stress. The stock-bond relationship has historically provided an important source of portfolio balance, but that protection may weaken when equities and government bonds sell off together. Liquid alternatives may offer exposure to return drivers that are less dependent on the direction of these two markets. Their strategic value therefore lies less in competing with equities or bonds for returns, and more in reshaping portfolio behavior when both are under pressure. In a regime where inflation, fiscal and geopolitical shocks can disrupt traditional correlations, this tail-state diversification may become an increasingly important component of portfolio construction.
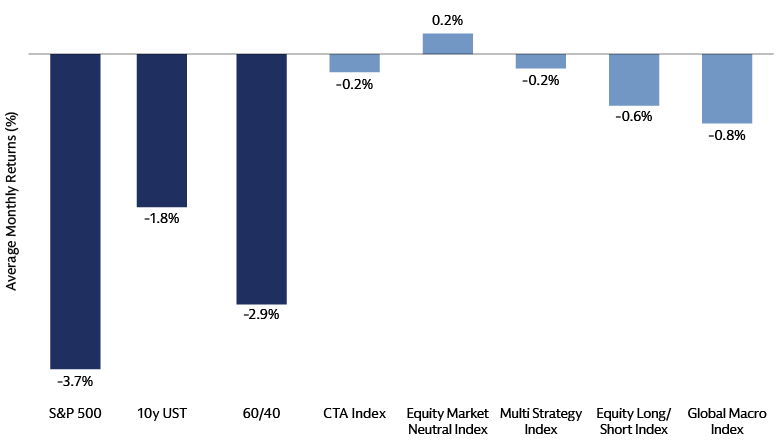
Source: Macrobond and Goldman Sachs Asset Management. As of October 1, 2026. Analysis identifies months in which both the S&P 500 and 10-year US Treasury total return indices generated negative total returns. Average strategy returns are measured using monthly total returns from January 1997. Liquid alternative strategies are represented by Barclays Hedge indices.
1 Bundesbank. As of May 2026.
2 IRS. As of January 26, 2026. U.S. Department of the Treasury. As of August 3, 2026.
3 Goldman Sachs Research. As of August 9, 2026.
4 Goldman Sachs. As of August 7, 2026.
5 International Monetary Fund. As of July 8, 2026.
6 YouGov. As of September 15, 2026.
7 Goldman Sachs Research. As of August 3, 2026.
8 Goldman Sachs Research. As of August 3, 2026.