Retirement Survey and Insights Report 2026

Making Every Dollar Saved Work Harder
For generations, consistent employment and regular saving have been important foundations of retirement security. Our Retirement Survey and Insights Report 2026 suggests that many workers continue to face competing financial demands that can make retirement saving more difficult.
The retirement challenge facing Americans today is no longer simply participation or access. Many workers are employed, contributing to retirement plans, and doing what conventional wisdom tells them to do. Yet financial strain remains widespread. Housing, healthcare, education, caregiving, and day-to-day living costs are consuming an increasing share of household resources, leaving less capacity to save for the future.
The result is a fundamental shift in the economics of retirement. Employment remains essential for retirement security, but for many Americans, it is no longer sufficient.
This year's research reveals a striking contradiction: workers report financial stability on the surface while displaying growing signs of financial strain underneath. They are working more, delaying financial goals, and increasingly turning to second jobs to bridge the gap between income and expenses. Beneath strong employment and resilient consumer spending lie growing financial pressures that threaten long-term retirement readiness.
The good news is that better planning, personalized advice, stronger portfolio construction, and retirement income solutions can help savers make every dollar work harder.
Key Survey Findings
Household Costs Increasingly Compete with Retirement Saving
Housing, healthcare, education, caregiving, and everyday living costs have outpaced wage growth for decades, leaving many households with less capacity to save. The challenge is no longer participation. It is competing needs.
Financial Security Does Not Uniformly Improve with Income
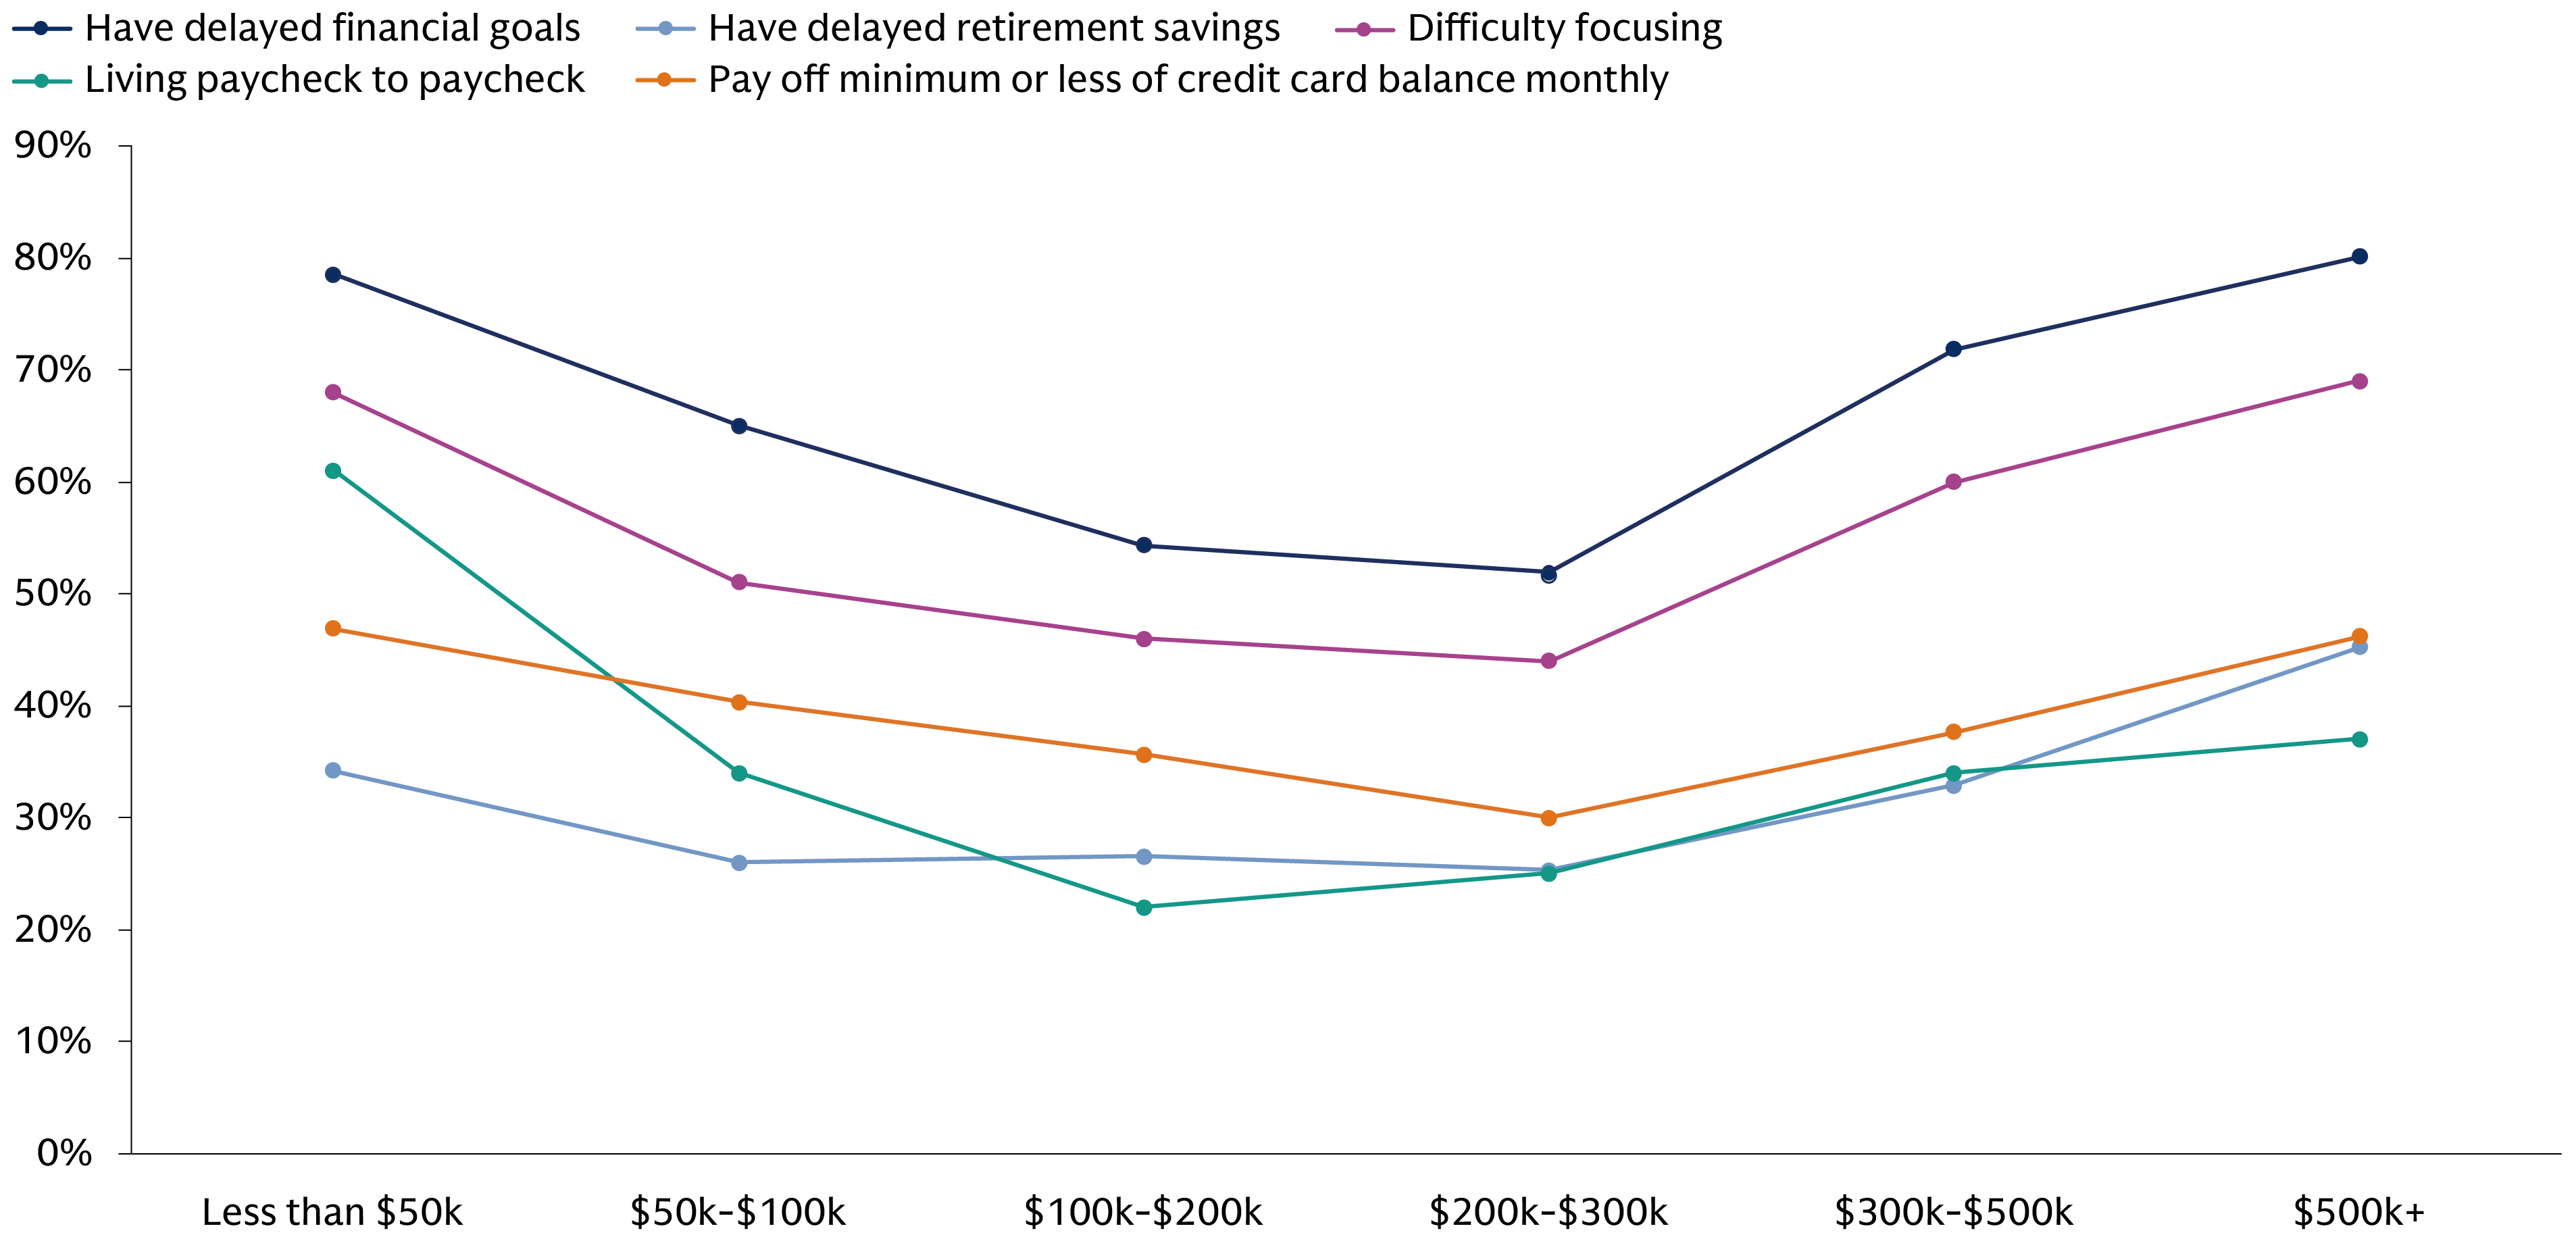
On several measures, financial concerns did not decline uniformly across income groups. Households earning less than $100,000 were most likely to report difficulty making progress toward long-term financial goals. Interestingly, certain financial concerns also appeared among some higher-income households, although the nature and retirement implications of those concerns may differ from those experienced by lower-income households.
Many Workers Supplement Income from Their Primary Job
More than one in three full-time workers, and nearly half of Generation Xers, say their job either only covers current expenses or is not enough to maintain financial security. Additionally, more than 60% of survey respondents have taken on work outside their primary job, most out of necessity rather than the desire to increase disposable income. These findings point to a workforce with increasingly diverse income sources, financial obligations, and retirement planning needs.
Financial Strain May Affect the Workplace
Financial strain may reach employers through lost productivity, absenteeism and disengagement, making financial wellbeing a shared imperative rather than a private burden.
Workers Are Deferring Financial Milestones
Nearly 70% of survey respondents have delayed a major financial goal, making it a “quiet” response to financial strain.
Highlights from Survey Respondents
Major Life Milestones Consume More Income Than it Did in 2000
For more than two decades, the share of a household’s paycheck available for saving has steadily narrowed. Housing, healthcare, education, and caregiving costs have risen faster than wages, turning what was once a budgeting challenge into a structural constraint on retirement preparedness.
Since 2000, overall consumer prices have roughly doubled. But the costs most consequential to a household’s ability to save have increased far more sharply: housing, medical care, childcare, tuition, and hospital services. These increases substantially outpace broad inflation and leave households with less discretionary income after meeting essential needs.1
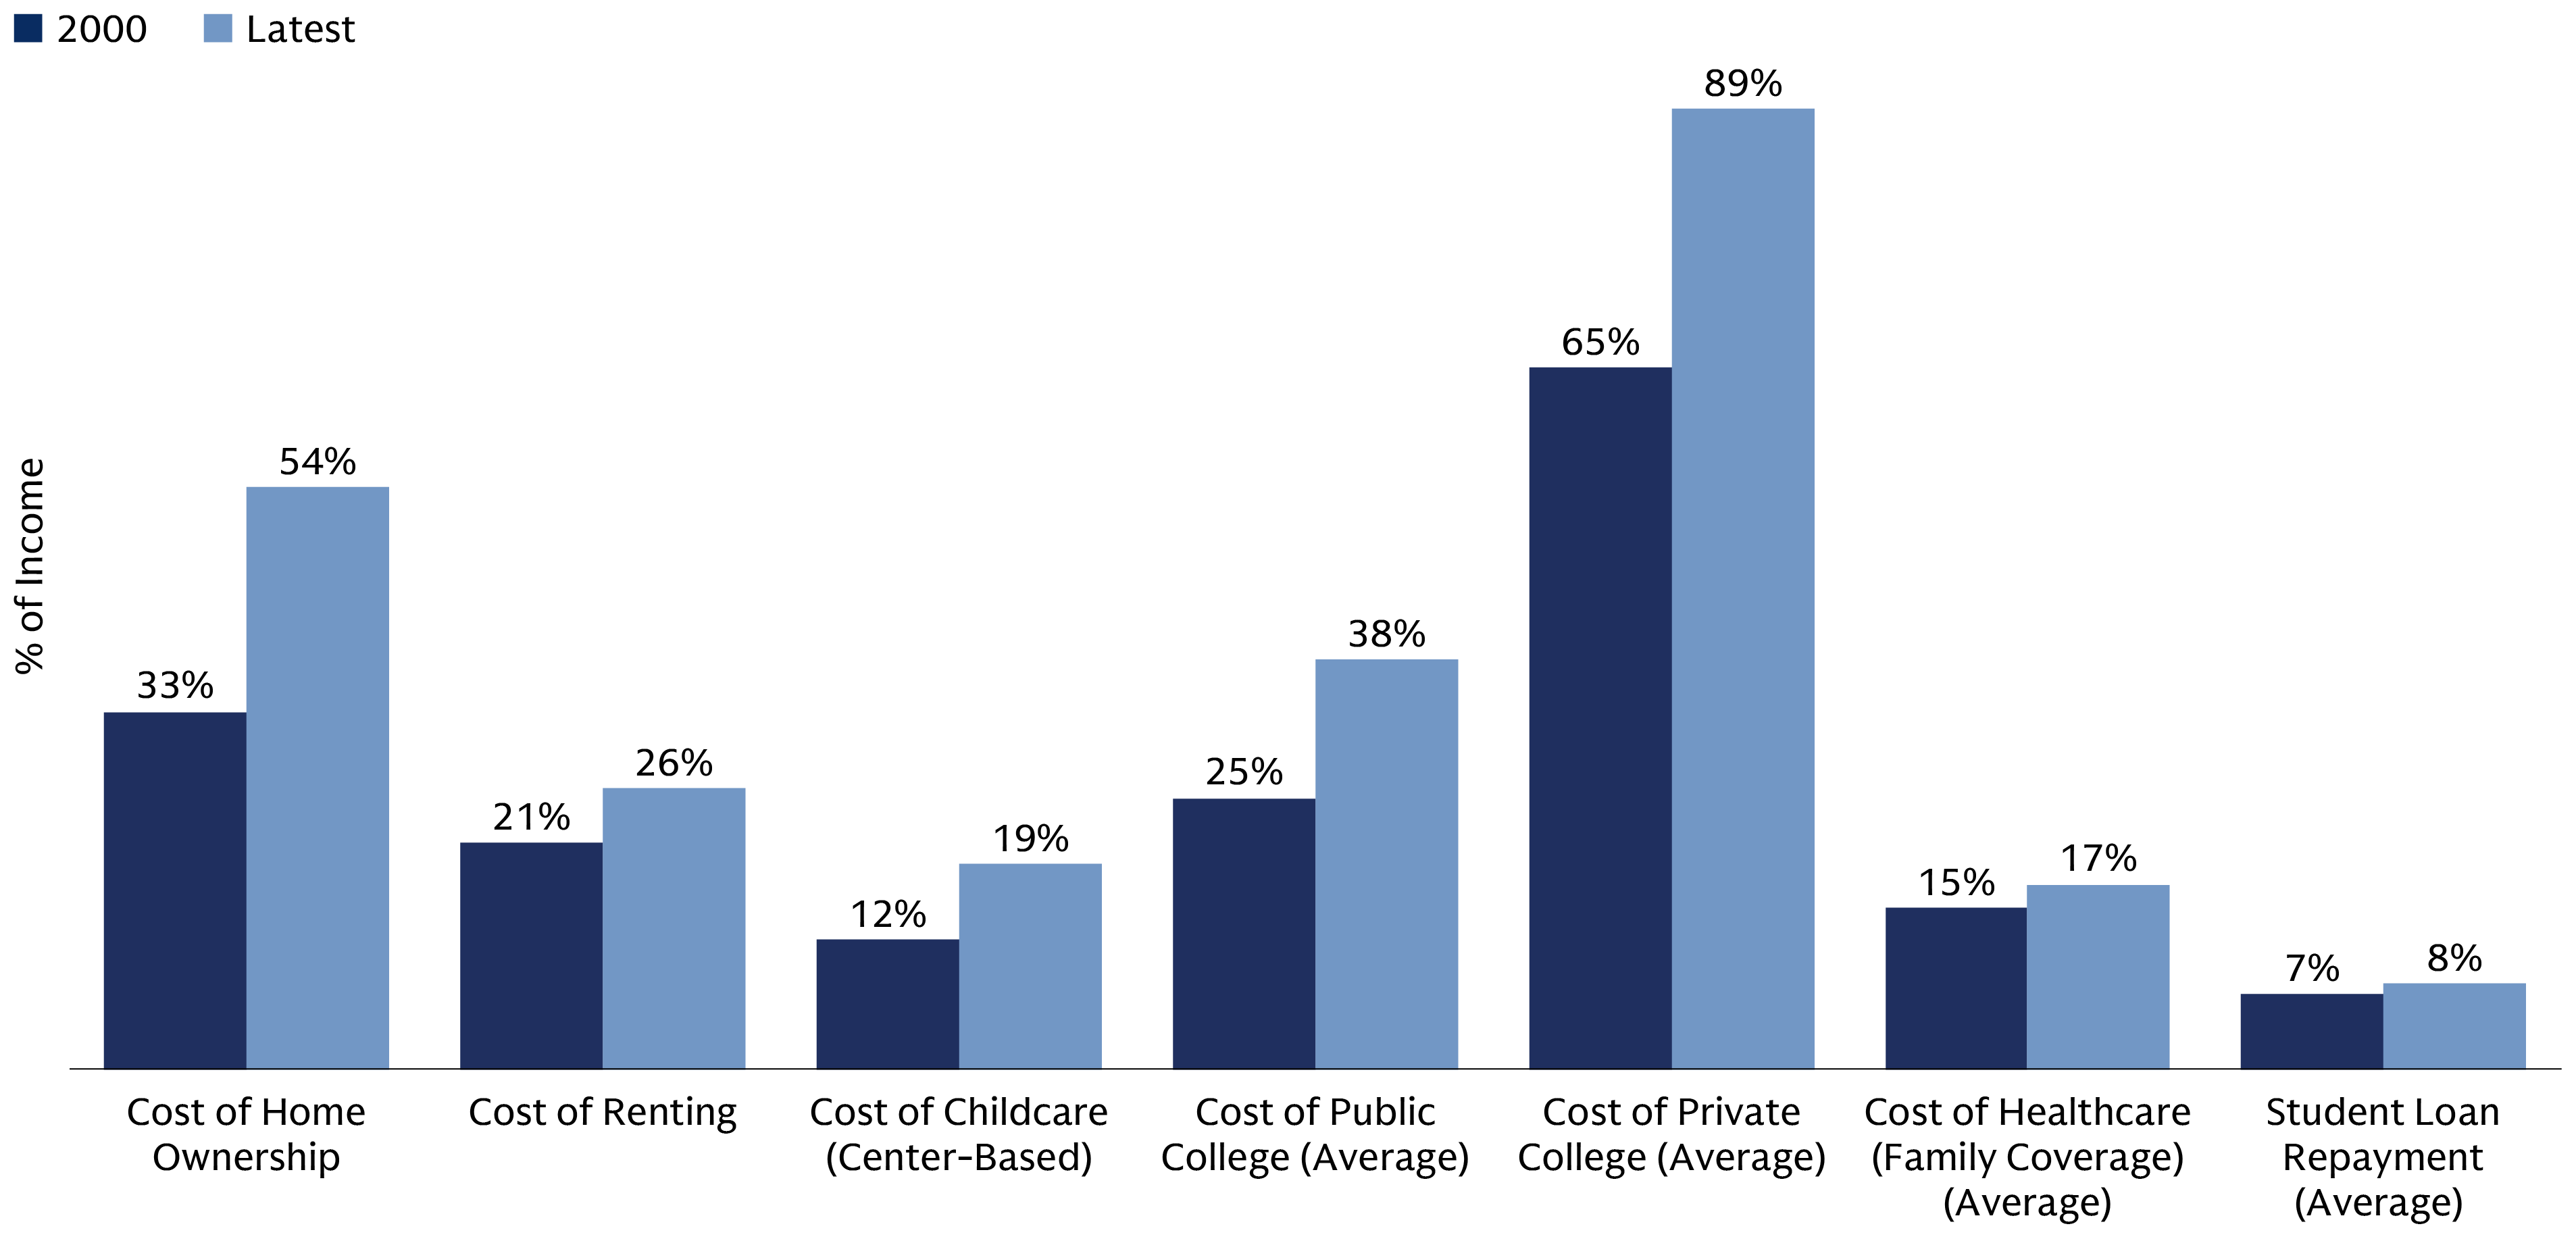
Refer to End Notes for detailed source information.
Financial Security Doesn’t Uniformly Improve with Income
It is often assumed that financial security tracks income in a straight trajectory, meaning that each additional dollar of earnings buys a corresponding measure of confidence and stability. The data tells a more interesting story. Financial security as reported does not rise in a straight line with income; it follows a u-shaped pattern, strain being felt in households making less than $100,000, improving through the middle income brackets, peaking among households earning between $100,000 and $300,000, and then, surprisingly, weakening among those earning above $300,000 annually.
In other words, the households that feel best about their finances are not the highest earners.
Retirement Saving Momentum is Stalling
Across every generation, fewer respondents said their retirement savings were on track. Among Gen Z, the share fell from 75% to 66%. Among Millennials, it dropped from 74% to 61%. Gen X declined from 58% to 49%, while Boomers fell from 69% to 60%. The pattern is broad-based and not isolated to one age cohort.
This marks a meaningful shift from 2025 and reinforces a more cautious interpretation of household financial health. Even amid favorable macroeconomic signals, elevated spending, pressure on savings and a lower personal savings rate suggest that many workers may be finding it harder to translate economic growth and market gains to improved savings rates. Approximately 74% of those who report living paycheck to paycheck also say that competing priorities affect their ability to save for retirement. If this population grows along this historical trend, there is growing concern this population will be able to adequately save for retirement.
Survey Question: Where would you say your retirement savings are at this moment?
The below represents Very ahead of schedule, Somewhat ahead of schedule, and On track
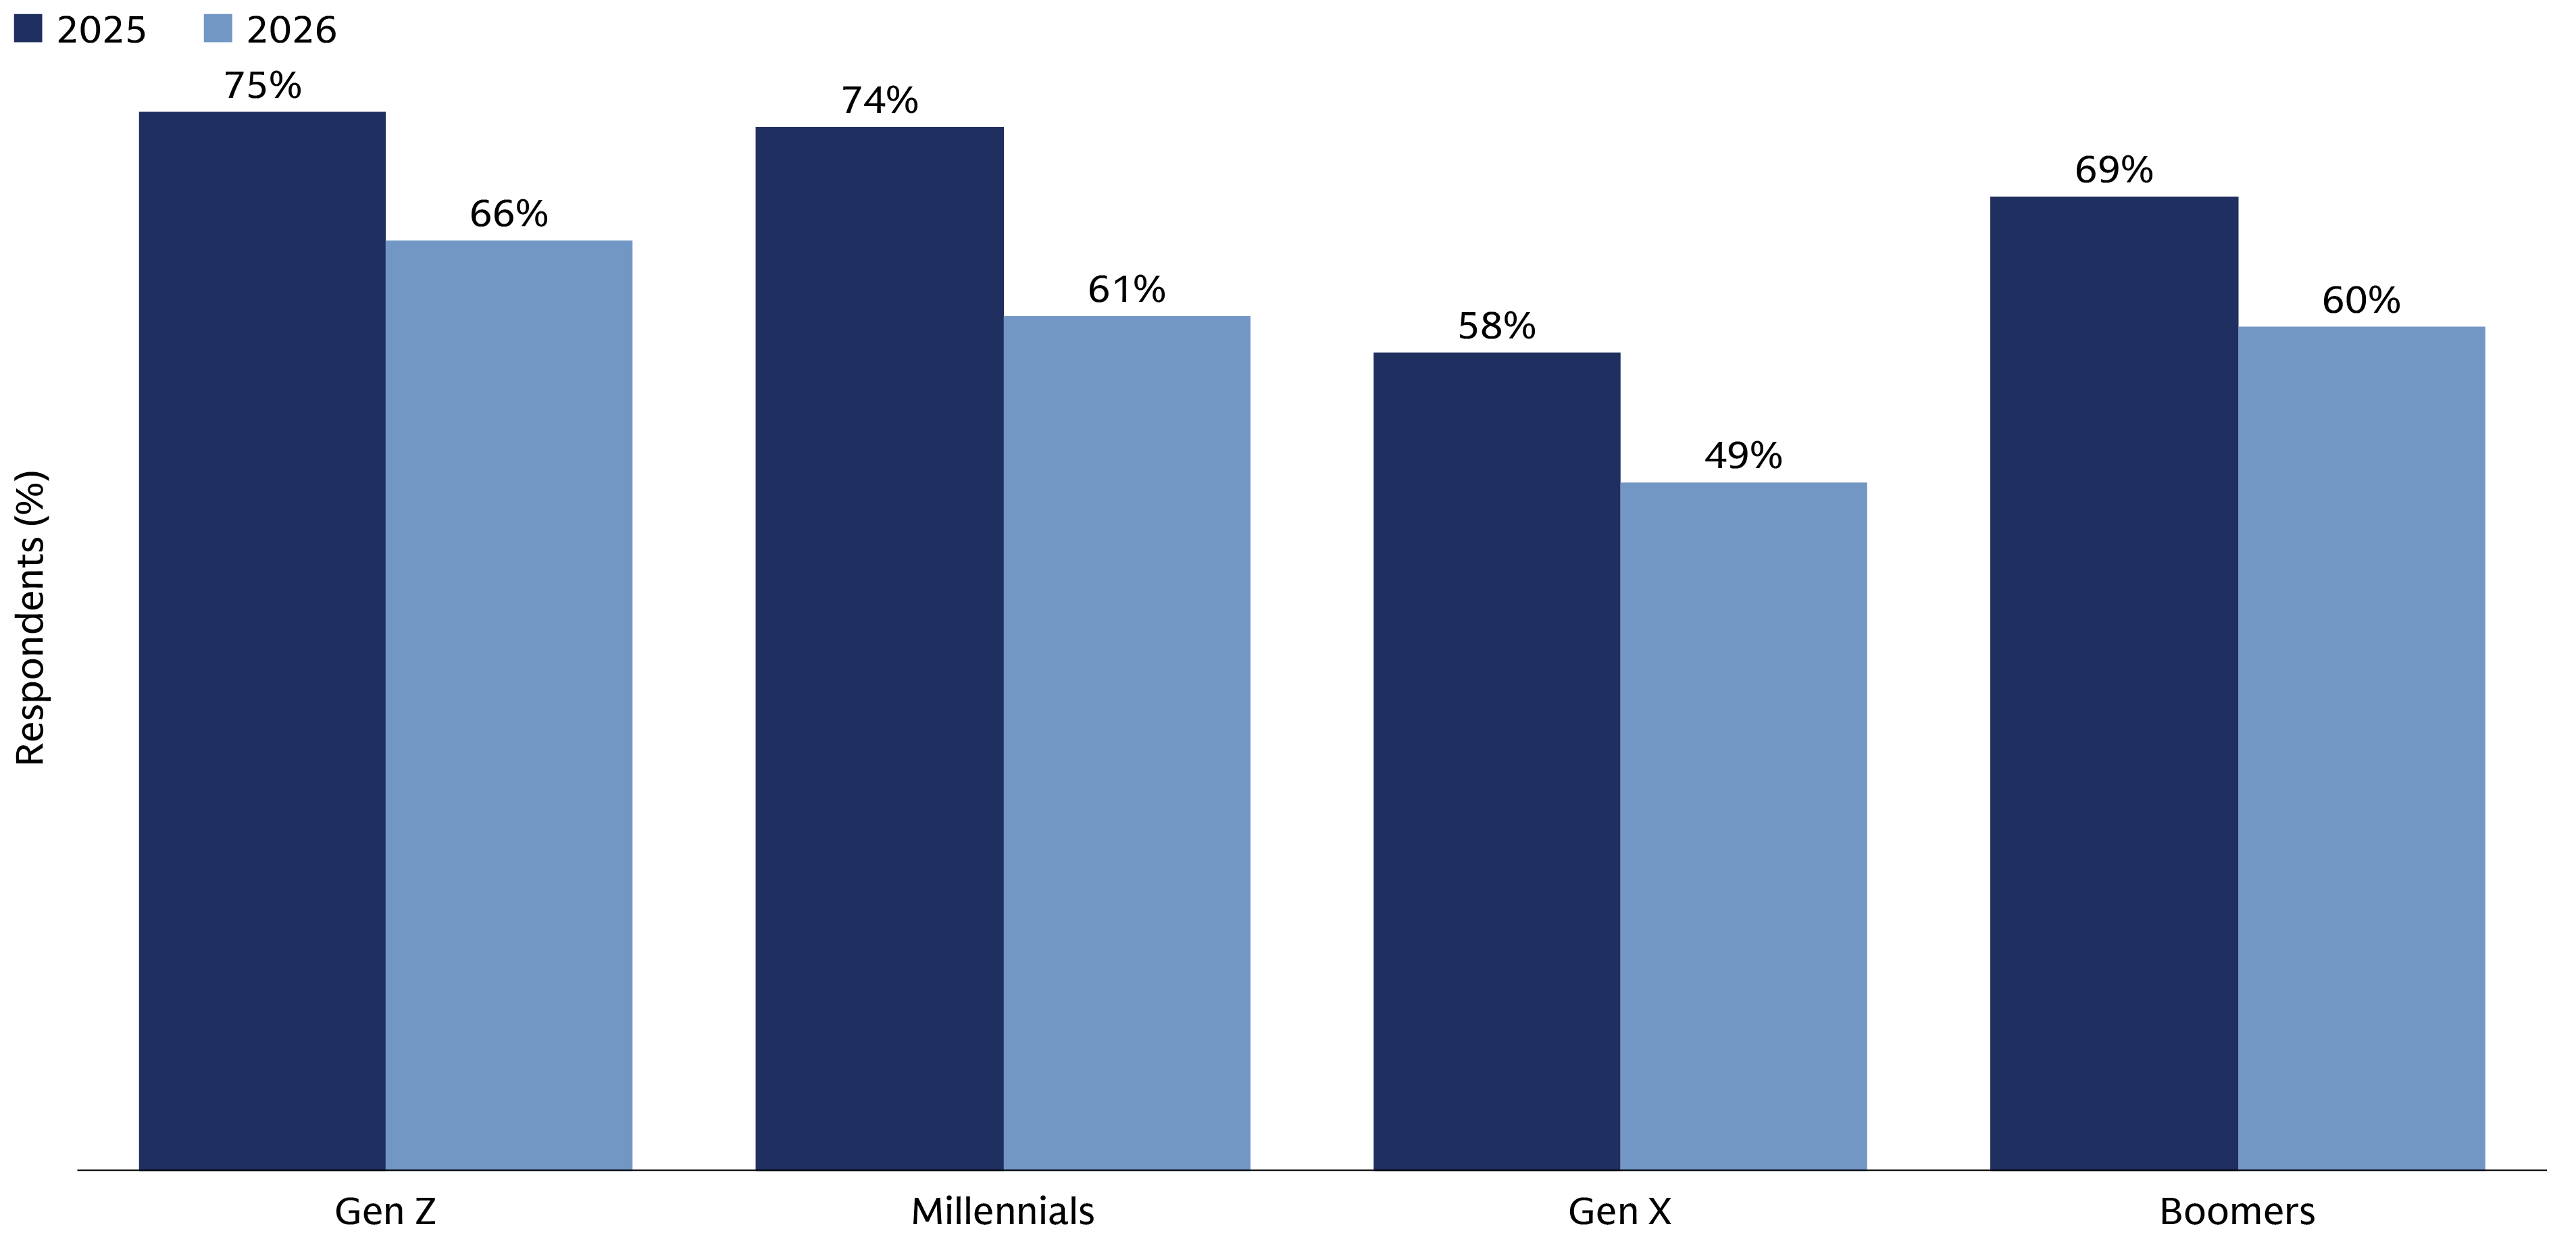
Responses included: Very ahead of schedule, Somewhat ahead of schedule, On track, Somewhat behind schedule, Very behind schedule.
Almost 50% of Younger Generations Looking to Find New Job to Improve Financial Security
Perhaps the most consequential finding for employers is the connection between financial strain and turnover intent. Nearly half of Gen Z workers (48%) and Millennials (47%) say they are likely to look for a new job in the next 12 months primarily to improve their financial situation. That compares with 32% of Gen X and just 14% of Boomers.
For employers, this represents a direct retention risk concentrated among early- and mid-career talent—the employees many organizations are working hardest to develop, promote and keep. When compensation and benefits fail to relieve financial pressure, workers may seek relief elsewhere. In that sense, financial stress is not only a personal challenge; it is a measurable workforce risk with implications for retention, succession planning, and organizational continuity.
Survey Question: How likely are you to look for another job in the next 12 months primarily to improve your financial situation?
Reporting Extremely likely and Somewhat likely
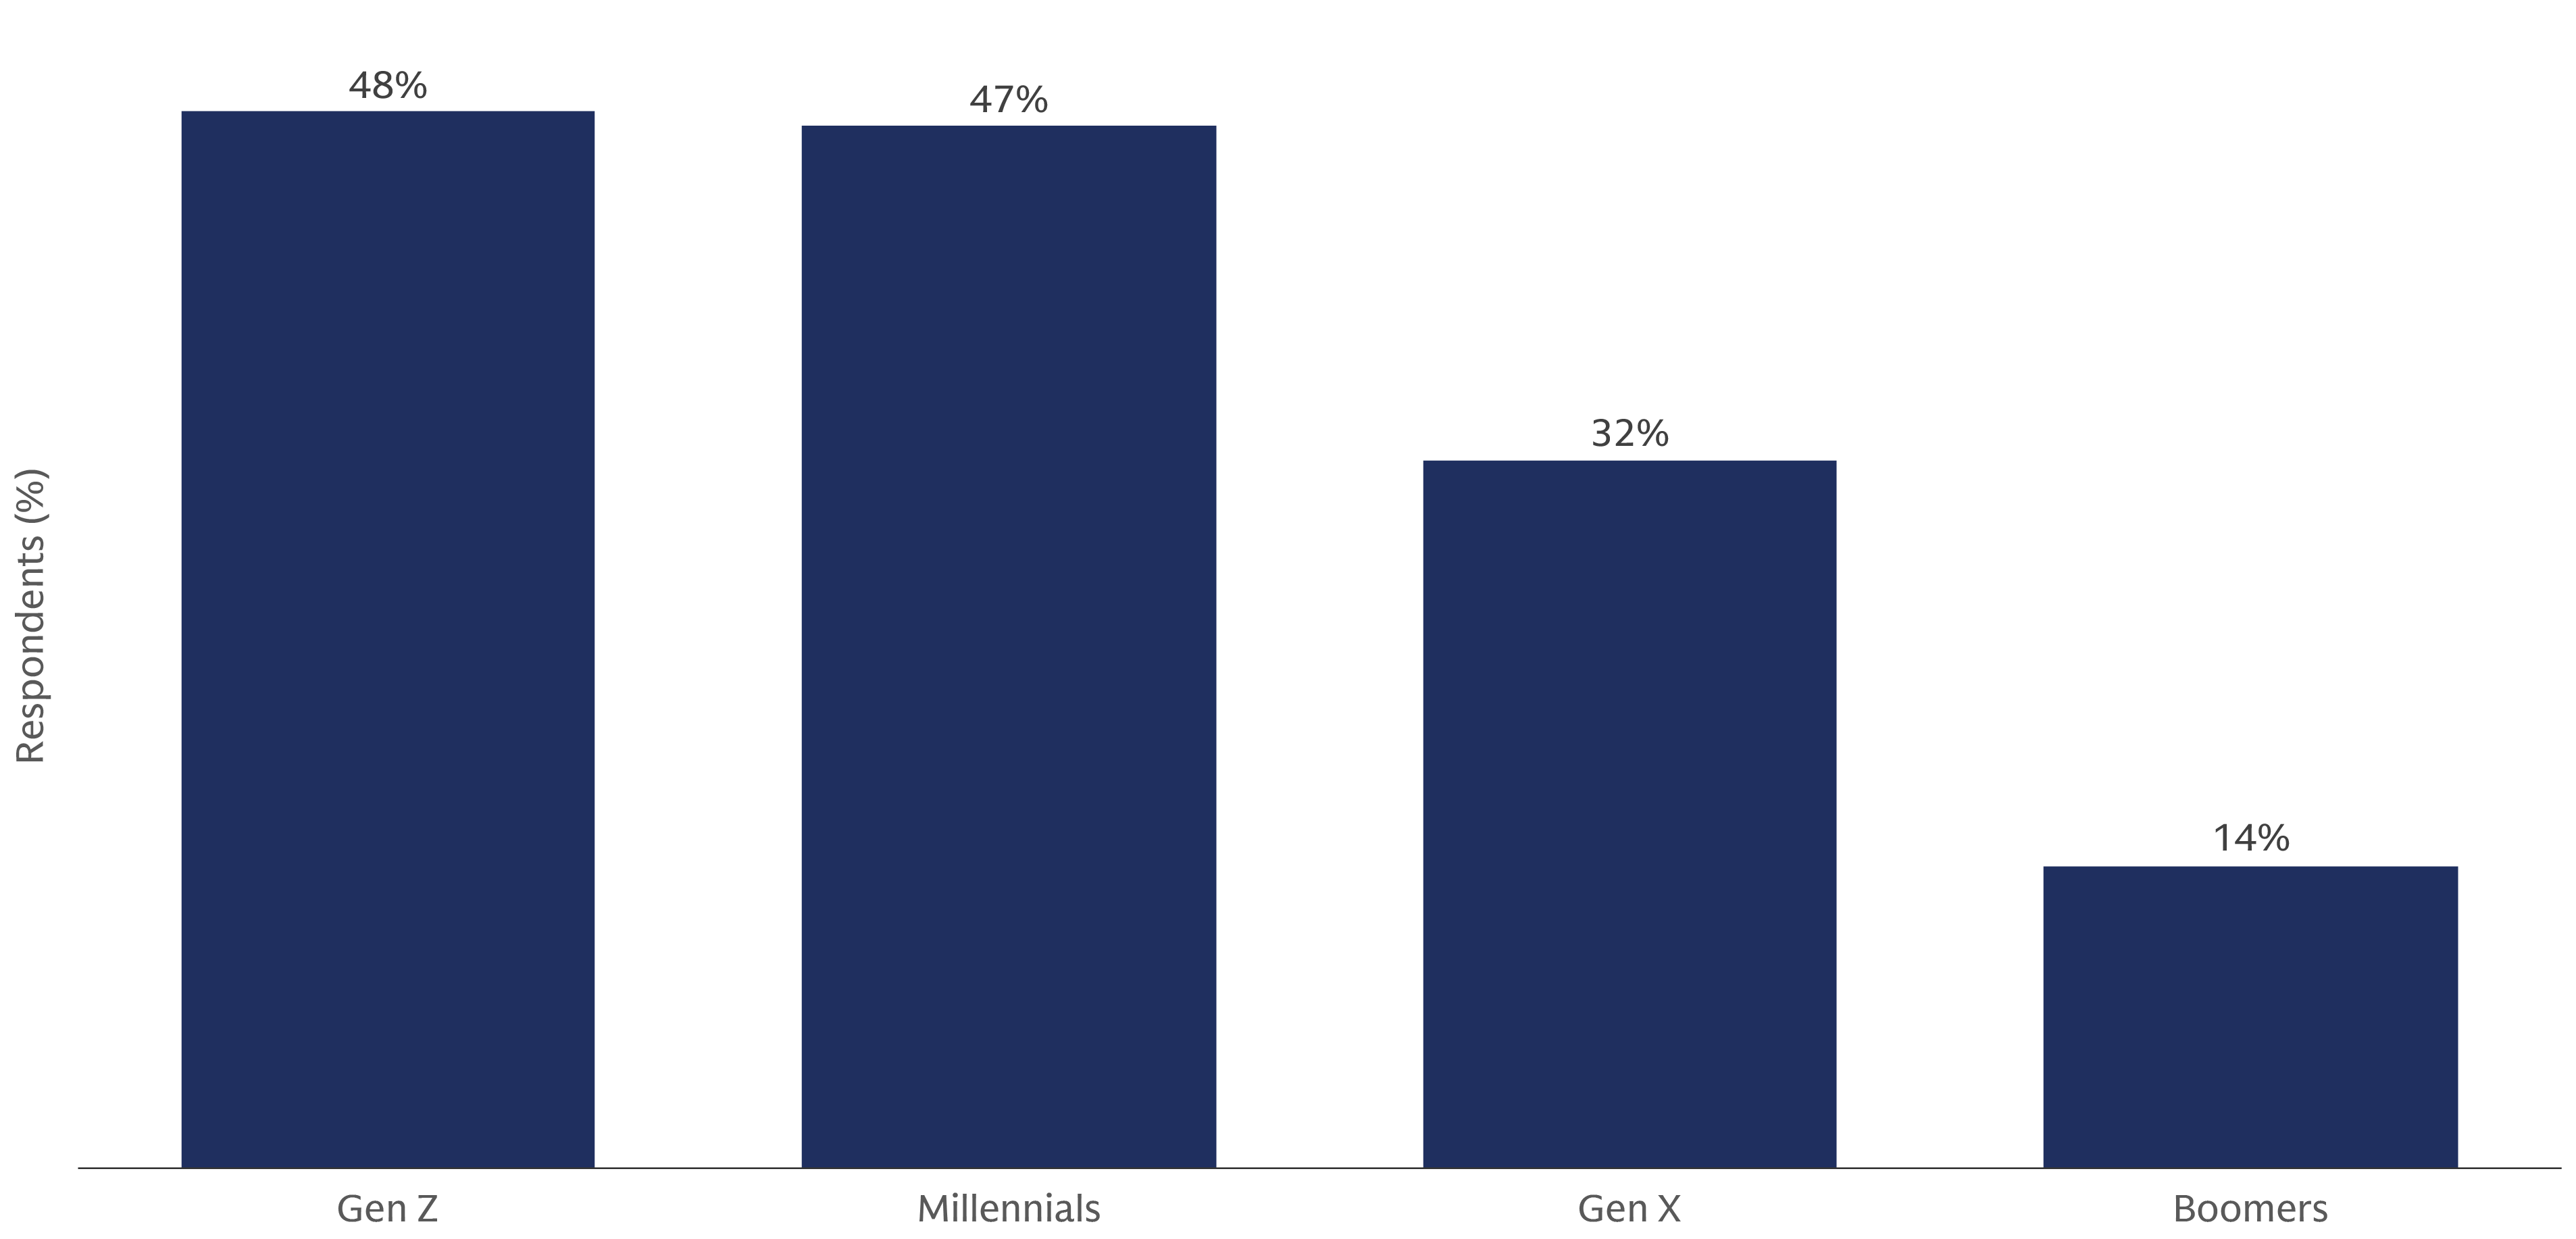
Responses include: Extremely likely, Somewhat likely, Neither likely nor unlikely, Somewhat unlikely and Extremely unlikely.

Making Every Dollar Saved Work Harder for the Future
As retirement saving becomes harder, the focus must shift from simply asking individuals to save more to helping every dollar saved work harder. While household financial strain is real, practical solutions can help savers stay on track, stretch their savings further, and build greater long-term security.
Personalized planning can help turn life’s disruptions from derailments into manageable detours. Enhanced investment portfolios, including broader diversification and access to professionally managed strategies, may help improve outcomes without requiring higher contributions. And as savers approach retirement, income solutions, both guaranteed and investment oriented, can help address longevity, market risk, and the need for confidence in retirement.
Together, these strategies can augment the effort savers are already making and help keep a secure retirement within reach.
Methodology and Respondents
We evaluated survey responses from both working and retired Americans to understand the realities of preparing for and living in retirement. Our goal is to learn about the financial obstacles individuals need to overcome and the lessons they can apply in their retirement journey. Our Retirement Survey & Insights Report includes key findings that we hope will help plan advisors and plan sponsors better prepare their employees for retirement.
Our findings are from 5,106 individuals surveyed in July 2026 and provide insights from a diverse set of perspectives, including (i) working individuals (3,612 working individuals across generations), and (ii) retired individuals (1,494 retired individuals ages 45-75).
To better understand how people make retirement savings and advice decisions in the face of many competing priorities, we engaged behavioral economics firm, Escalent. Escalent helped develop key questions in our survey to analyze behavioral characteristics discussed in this report, as well as analyze individuals’ retirement income preferences.
1 Median Household Income (after-tax): 2000: Median household income is $42,148 and assume effective tax rate is 18%; 2025: Median household income is $83,730 and assume effective tax rate is 18%; Source; US Census Bureau Median Household Income, Goldman Sachs Asset Management
Cost of Home Ownership: 2000: Median home price: $119,000, 8% mortgage rate, 20% down payment, Insurance estimate - $500, annual maintenance cost 1% of home value, taxes 1.1% of home value; 2026: Median home price: $418,610, 6.7% mortgage rate, 20% down payment, Insurance estimate - $2,490, annual maintenance cost 1% of home value, taxes 1.1% of home value: Sources: Federal Reserve Bank of St. Louis, US Census Bureau, Goldman Sachs Asset Management
Cost of Renting: 2000: Median gross rent: $602 monthly; 2026: Median gross rent: $1487 monthly: Source: US Census data, Goldman Sachs Asset Management
Cost of Child Care (Center-based): 2000: Median cost center-based childcare: $4,000 annually; 2026: Median cost center-based childcare: $13,184 annually; Source: Child Care Aware, Goldman Sachs Asset Management
Cost of Public College: 2000: Average tuition $3,510; average room and board $4,960. 2026: Average tuition $11,950; average room and board $14,034; Source: College Board, Goldman Sachs Asset Management
Cost of Private College: 2000: Average tuition $16,332; average room and board $6,209. 2026: Average tuition $44,961; average room and board $15,920; Source: College Board, Goldman Sachs Asset Management
Cost of Student Loan: 2000: Average federal loan balance $16,530; Interest rate assumption 6.9%, loan term assumption 10 years. 2026: Average federal loan balance $40,467; Interest rate assumption 6.5%, loan term assumption 10 years. Source: National Association of Colleges and Employers, Goldman Sachs Asset Management
Cost of Healthcare: 2000: average employee paid healthcare premiums $1,715; estimated out of pocket expense $3,360 (assume three family members). 2026: average employee paid healthcare premiums $6,850; estimated out of pocket expense $4,542 (assumes three family members). Source: Kaiser Family Foundation, Goldman Sachs Asset Management