Growth vs. Value: Rethink Your Investment Style
Investors have understood traditional definitions of Value and Growth as discrete investing styles that have taken turns dominating the market, but it may be time to take a holistic look at what drives alpha for a given company’s stock.
The concepts of value and growth were first introduced by Eugene Fama and Kenneth French in their 1992 Three-Factor Model1 to help explain long-term investment returns in excess of the market. Fama and French defined Value stocks as those equities that have high book-to-market-value ratios, and Growth stocks as those that have low book-to-market-value ratios. The intuition is that Value stocks have low prices relative to their “intrinsic” value, i.e., their book value, but are characterized by high dividend yields and are therefore perceived to be undervalued. In contrast, the benefit of Growth stocks is the ability to potentially grow their cash flows over time and generate a higher return on assets in a way that’s less representative of the current book value of their assets.
Another way to categorize a company’s stock by style is to look at the net present value formula. Growth stocks often derive a bigger portion of their value from cash flows farther out in the future, so they may exhibit more sensitivity to changes in underlying interest rates, which affect the denominator in the discounted cash flow calculation. Value stocks’ cash flows are typically more evenly spread out, and so are less sensitive to changes in interest rates. This has implications for investors’ behavior: when capital is inexpensive, investors tend to invest in the future, i.e., Growth stocks, but if capital is expensive—which is normally the case when the inflation rate is high as central banks raise rates to fight it—investors generally prefer to focus on companies that have a shorter duration, i.e., Value stocks.
The post-pandemic environment of firmer inflation, higher yields and, until recently, above-potential growth has seen the resurgence of Value investing after 15 years of underperformance, prompting many commentators to herald the beginning of a long period of Value dominance. While Value might be more dominant in the coming market cycle, we believe investors could consider a full complement of Growth and Value in strategic portfolios.
Value vs. Growth: A Historical Perspective
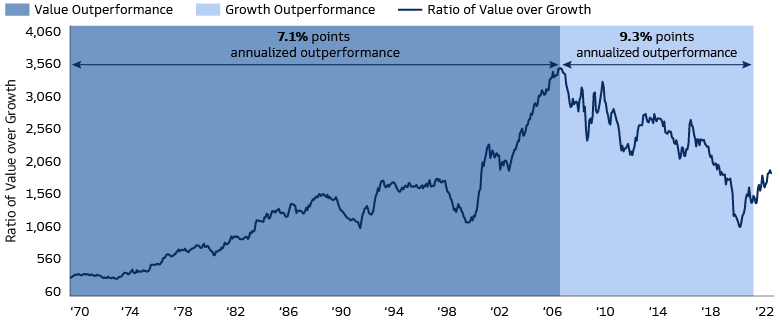
Value has a long track record of outperformance, dominating the period between 1970 and early 2007 on a cumulative basis. By contrast, Growth prevailed from mid-2007 until the COVID-19 pandemic, when Value started to outperform again.

Source: Kenneth R. French, Bloomberg and Goldman Sachs Asset Management. As of March 9, 2023. Data from January 1970 to January 2023. The ratio of Value over Growth is defined as the ratio of Fama/French H20 portfolio formed on Book-to-Market factor and Fama/French L20 portfolio formed on Book-to-Market factor. Value regime is defined as the period between January 1970 to February 2007. Growth regime is defined as the period between March 2007 and September 2020. Past performance does not guarantee future results, which may vary.
That said, whenever we look to the past as a way of helping to inform the future, it’s important to be mindful of the interplay between cyclical dynamics and secular trends. Secular trends (those likely to continue moving in the same general direction for the foreseeable future) can dominate a cycle and determine long-term performance of Growth vs. Value.
Value and Growth environments are marked by very distinct secular drivers. Value dominance tends to assert itself when inflation is high, economic growth is strong and rates are elevated. By contrast, Growth stocks often outperform when inflation is low, economic growth is relatively weak and rates are low and falling.
There are two main reasons why inflation appears to favor Value stocks. First, inflation often happens when demand exceeds supply. At that point, earnings growth is commonly available, so investors are less willing to pay a premium for it. At the same time, demand is usually high for the traditional industries that typically comprise Value stocks. Second, the present value of an asset—especially those whose cash flows are in the future—partially depends on the cost of capital.

Source: Kenneth R. French, Bloomberg, Haver Analytics, Macrobond, and Goldman Sachs Asset Management. As of March 9, 2023. Value regime is defined as the period between January 1970 to February 2007. Growth regime is defined as the period between March 2007 and September 2020. Inflation is measured by the YoY change in US CPI. Growth is measured by the QoQ change in US real Gross Domestic Product (GDP) annualized. Unconditional refers to the entire period, not conditional to either Value or Growth outperformance. The 10-Year Yield is the yield on a generic US 10-year government bond. Value outperformance is calculated using the annualized performance of monthly returns on the Fama/French H20 portfolio formed on Book-to-Market factor during the Value period. Growth outperformance is calculated using the annualized performance of monthly returns on Fama/French L20 portfolio formed on Book-to-Market factor over the Growth period. All values are averages over the period. Past performance does not guarantee future results, which may vary.
For most of the post-World War II era until the 1970s, interest rates kept rising in response to ever-higher inflation, leading to a period of clear Value dominance. By the time inflation started to come down in the early 1980s, it had become so entrenched that investors were doubtful that this was the start of a new trend, as bond yields remained much higher than reported inflation for a long time. Cyclical shifts in Value vs. Growth leadership became more frequent during this period, but with inflation rates remaining in the high single digits until the early-2000s and economic growth staying relatively robust, Value mostly prevailed.
Value largely dominated until the 2008 Global Financial Crisis (GFC), kicking off an era of secular stagnation, which was very supportive of Growth. The post-GFC era was characterized by a period of stubbornly mediocre economic growth. This kept inflation at record low levels and prompted central banks to go out of their way to stimulate the economy by keeping interest rates near zero or even negative and flooding the markets with cheap money through quantitative easing programs. With the cost of capital negative and growth scarce, investors put their money in the few companies that delivered earnings growth. There were several reversals throughout this period but none of them lasted very long, as disinflationary forces and lower bond yields reasserted themselves.
The outperformance of Growth stocks peaked in 2020, when the COVID-19 pandemic sent global economic growth into a deep contraction and central banks went into overdrive. As the world moved online, Growth benefited as innovation and disruptions accelerated, and the digital uptake that would have needed years to take hold emerged in mere months. On the other hand, many Value sectors saw their revenues disappear due to widespread lockdowns.
The latest turning point for Value occurred with the COVID-19 vaccine announcements, which allowed countries to reopen and led to a sharp increase in inflation. This was exacerbated by the war in Ukraine, prompting central banks to embark on the fastest and steepest tightening cycle in decades. In the short term, however, cyclical dynamics could generate significant price movements in the opposite direction.
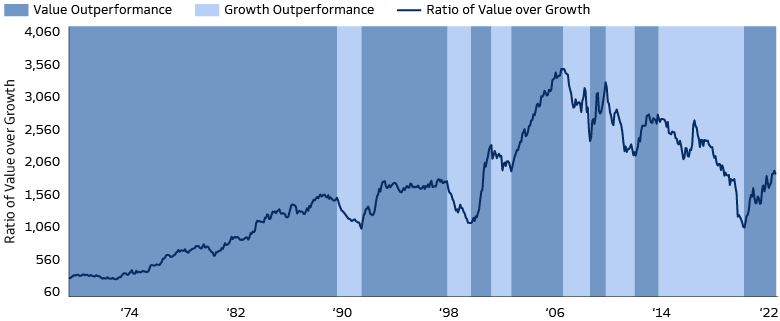
Within the broad market trends, we find brief periods of reversal, and that style dominance has been more nuanced. A look at cyclical inflection points shows that the two secular trends of dominance of one style over the other—1970-2007 for Value and 2007-2020 for Growth—contain bouts of outperformance of the other style. Since January 1970 there have been seven periods of more than a year when Value dominated, and seven periods of more than a year when Growth outperformed. On a higher frequency, those counts would be significantly higher.

Source: Kenneth R. French, Bloomberg and Goldman Sachs Asset Management. As of March 9, 2023. Data from January 1970 to January 2023. The ratio of Value over Growth is defined as the ratio of Fama/French H20 portfolio formed on Book-to-Market factor and Fama/French L20 portfolio formed on Book-to-Market factor. Style outperformance is defined as a period of at least 12 months of value or growth outperformance higher than 3 percentage points. Style changes of less than 12 months and with a performance difference of less than 3 percentage points over the period during opposite style regime were ignored. Past performance does not guarantee future results, which may vary.
What’s Next for Value vs. Growth
Over the next year or so, we believe that the risks to the macro environment are skewed in favor of continued Value outperformance. The inflation rate, while falling, is likely to remain above central banks’ targets until the end of 2024. Meanwhile, faced with elevated inflation, central banks are unlikely to rush into cutting rates this year. And while economic growth has been slowing—which would normally boost Growth stocks—it has been better than expected.
Beyond that, leadership in style will depend on the prevailing levels of long-term economic growth and neutral interest rates. A key question is whether the trends of weak growth and low inflation expectations that have dominated the post-GFC era will reassert themselves, or if this marks the beginning of a sustained period of stronger growth, higher inflation expectations and interest rates.
While a sustained shift towards 1970s-type inflation rate looks unlikely, there are good reasons to think that the current higher inflation is neither transitory nor persistent, but rather structural, driven by forces such as aging demographics, deglobalization and decarbonization. The past 20 years have been defined by affordable and plentiful supplies of energy and labor. Both are becoming scarcer and more expensive as countries turn inward and commodities are weaponized. Growth is likely to be more volatile, and we expect commodities to play a more central role in driving economic growth than they have in previous business cycles. In this environment, the clear distinction between Growth and Value is likely to fade and give way to a greater focus on alpha opportunities and increased sector and geographical diversification. Technology is becoming a larger component of all industries, while the shift to decarbonization is enhancing growth opportunities in the parts of the market that had underperformed for so long.
Additionally, profound change in the nature of the assets employed by businesses to generate economic value—specifically the rise of intangibles—may make traditional definitions of Growth and Value less accurate. Indeed, current accounting conventions, which evolved in the mid-20th century to reflect the economic reality of businesses whose operations relied primarily on physical assets, struggle to capture the true economic performance of intangible-driven businesses and can therefore create a distorted picture of Value.
Software costs are one example of an intangible that can be used to boost economic value. This reduces both reported accounting profits and balance sheet assets, thereby increasing price-to-earnings ratios and price-to-book ratios. Such a business would appear prohibitively expensive when assessed through the lens of Value investing, even though it is in fact creating value for shareholders. This shows that relying on any kind of categorical label for investing may not be ideal.
There are also some limitations in the way benchmarks are constructed. For example, some 170 stocks in the MSCI World Index—roughly 10% of the universe—feature in both the MSCI World Value and the MSCI World Growth benchmarks. This reinforces the need to look beyond style as the sole driver of an investment decision.
A Balanced Approach
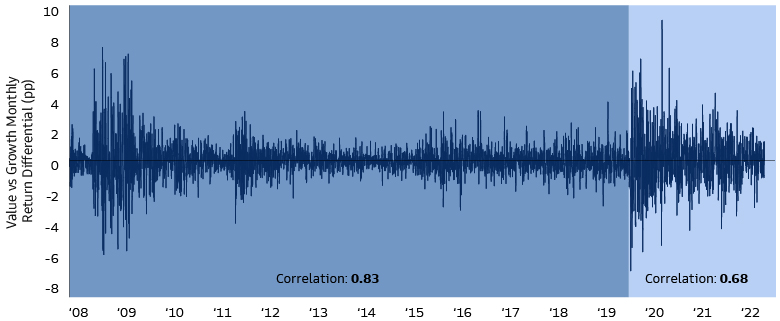
While style rotation can add value, the degree of difficulty in timing correctly appears high. The best- and worst-case scenarios to timing style rotations can generate a wide dispersion of outcomes. On average, investors must correctly time 60% of style rotations in order to beat market performance. Recent declines in correlations between style returns, from 0.83 in 2008-2019 to 0.68 since 2020, mean that outcomes have become more binary, potentially amplifying the upside and downside of extreme style tilting.

Source: Kenneth R. French, Bloomberg, and Goldman Sachs Asset Management. As of January 31, 2023. Correlations are calculated based on daily return differentials between growth-style equities and value-style equities. Correlation of 0.83 is derived from the daily returns of Fama/French H20 (Value) and L20 (Growth) portfolios formed on Book-to-Market factor, using the time range January 2, 2008 – December 31, 2019. Correlation of 0.68 is derived using the same portfolios daily returns from time range January 2, 2020, through January 31, 2023. Past performance does not guarantee future results, which may vary.
Over most of the last 15 years, investors have become accustomed to lean heavily on Growth, the style that was clearly outperforming up through 2020. But in a world where style leadership shifts might be more frequent and long-term secular megatrends may increasingly appear across style and regions, owning a full complement of Growth and Value in strategic portfolios may well pay off. Investors may also benefit from evaluating other factors related to a specific company’s financials to construct a portfolio.
We’re living in market conditions that have not existed for a long time. From a macroeconomic and geopolitical standpoint, the world is becoming more complex and changing, and we believe the investment approach should change as well. Compartmentalizing investments into traditional categories—Growth or Value, country, sector, public or private—may not be the optimal way to approach the investment opportunity set ahead.
Finally, in this new world, changes in style leadership may become more frequent, making it harder to anticipate market trends and portfolio moves more costly to implement. As a result, generating alpha in these conditions would require investors to consider the entire investment universe holistically and be precise in identifying the future wealth creators. We think the companies contributing to alpha going forward will innovate, disrupt, enable, adapt, and be diverse across global markets.
1Fama, Eugene F., and Kenneth R. French (1992). “The Cross-Section of Expected Stock Returns”, Journal of Finance, 47, pp. 427-465
