Quantitative Precision: Seeking to Unlock High Alpha Potential in European Equities

Key Takeaways
Generating alpha has always been paramount for equity investors seeking to complement market beta returns. Today, amid moderating market return expectations, its significance has intensified. Globally, constrained forward market returns are anticipated even in historically robust markets like the US. This is largely attributable to elevated starting valuations and significant market concentration in a handful of mega-cap stocks. In this context, this article highlights Europe as a compelling yet often-overlooked source of alpha, offering crucial portfolio value. Europe's equity markets, we contend, provide fertile ground for quantitative strategies to systematically extract value, especially where traditional investment methods may face greater challenges.
Abundant Alpha Potential
Europe's equity markets may offer high alpha potential, making the region ideal for a differentiated quantitative investment approach. Its diverse and fragmented nature fosters significant inefficiencies, coupled with lower informational coverage and slower information diffusion. In our view, these dynamics can potentially create a highly beneficial environment for quantitative strategies.
Diversity and heterogeneity
Europe's equity markets fundamentally differs from more homogenous markets like the US, presenting a vast and profoundly heterogeneous landscape. It operates as a complex amalgamation of diverse equity markets, often working both collaboratively and independently. This fragmentation is evident in its over 50 countries, 24 official languages, varied regulatory regimes, and distinct governmental policy priorities. The intricate central banking structure, encompassing the European System of Central Banks (ESCB) with the ECB and national central banks of all 27 EU member states, further highlights this complexity.1 Moreover, significant economic disparities, from wide-ranging GDP per capita and inflation levels to varied corporate tax rates, contribute to the region's unique market dynamics.
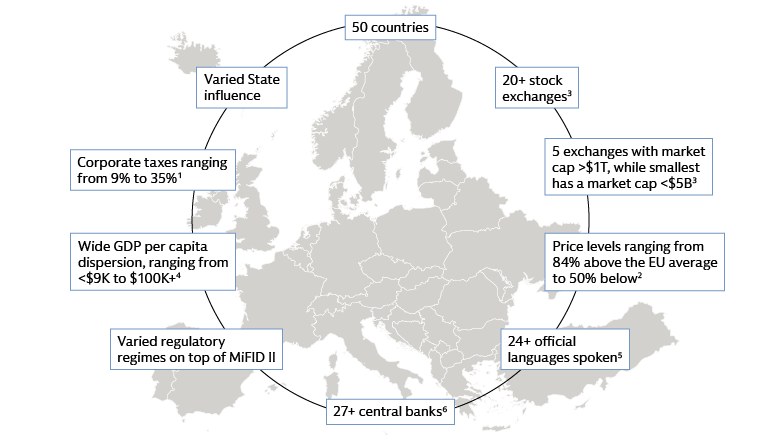
Source: Goldman Sachs Asset Management 1. Tax Foundation Europe, as of January 16, 2024. Lower and upper bounds refer to Hungary and Malta respectively. 2. Eurostat as of December 31, 2023. Price levels are based on Individual Consumption (AIC). Price level indices (PLIs) are the ratios of PPPs to exchange rates. They are presented relative to the European Union average. Lower and upper bounds refer to Romania and Switzerland respectively. 3. World Federation of Exchanges, as of January 31, 2024. 4. Eurostat and World Bank as of December 31, 2023. Lower and upper bounds refer to Bosnia and Luxembourg respectively. 5. Europa.eu. As of July 17, 2025. Considers official languages in the European Union alone. 6. Considers Central banks of the European System (ESCB).
Europe's inherent diversity is clearly reflected in its benchmark equity index, MSCI Europe, which exhibits lower concentration and greater balance across country and sector levels compared to the US market. For instance, the IT sector constitutes over 33% of the US large-cap equity market, while Europe's two largest sectors, Financials and Industrials, each account for approximately 20%. Furthermore, the top 10 companies represent over 37% of the S&P 500 but less than 18% of MSCI Europe.2 This distinction is also evident in prominent company groups: Europe's "GRANOLAS" (GSK, Roche, ASML, Nestle, Novartis, Novo Nordisk, L'Oreal, LVMH, AstraZeneca, SAP, and Sanofi) comprise approximately one-quarter of Europe's market capitalization and are characterized by diverse sector and industry makeups, varied business models, and broad macroeconomic exposure. In contrast, the US Magnificent 7 (Alphabet, Amazon, Apple, Meta, Microsoft, Nvidia, and Tesla) are largely a more homogenous group of companies, thematically focused on mega-cap technology.
Informational coverage inefficiencies
Information in European markets tends to be less abundant, more dispersed, and slower to diffuse than in the US. This is evidenced by lower analyst coverage—a market cap-weighted average of 24 analysts per stock in Europe versus 44 in the US—and fewer news articles per stock (14 average articles tagged per stock in Europe compared to 36 in the US). Analyst coverage in Europe has been declining, with the median quarterly coverage among MSCI Europe stocks falling by 40% since 2015. At a country level, analyst coverage distribution per stock varies widely, and is unrelated to the number of stocks per country. At a sector level, news coverage per stock in Europe is spread across sectors rather than concentrated among select few, like in the US, where tech and communication services capture most of the media’s attention. This dispersion and scarcity of information in Europe creates market inefficiencies, leading valuable information to not be always immediately reflected in asset prices.
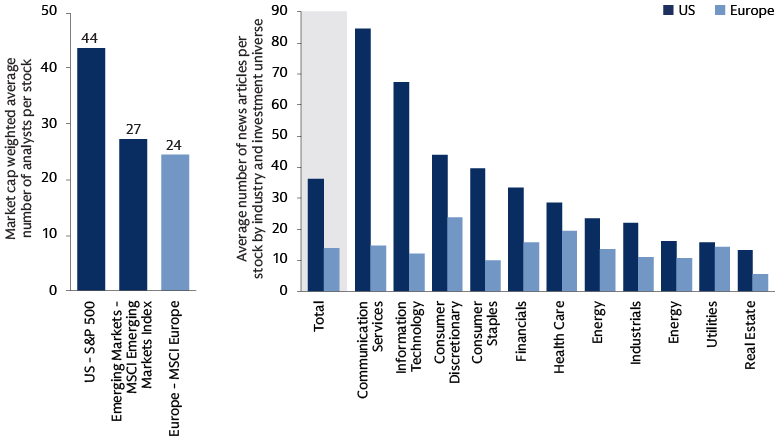
Left: Goldman Sachs Asset Management, MSCI, Bloomberg. Market cap weighted average number of analysts per company as of 11 August 2025. For illustrative purposes only. Right: Goldman Sachs Asset Management, Dow Jones. As of December 31, 2024.
Complexity and fragmentation
European equity ownership is highly fragmented and less domestically oriented compared to the US, with only 58% of European equities owned locally, compared to 82% in the US. This figure varies widely by country, from 65% of domestic ownership in Norway to as low as 23% in Portugal. This fragmented ownership can further complicate the price discovery mechanism in Europe compared to more unified markets with higher domestic ownership.
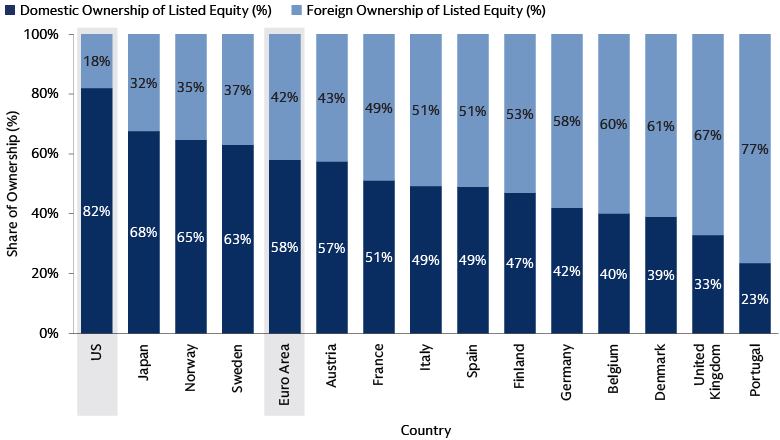
Source: Goldman Sachs Asset Management, Goldman Sachs Global Investment Research. Based on financial accounts data availability, as of June 30, 2025 for all jurisdictions except aggregate Euro Area (as of March 31, 2025) and Japan (as of December 31, 2024). The portfolio risk management process includes an effort to monitor and manage risk but does not imply low risk. There is no guarantee that objectives will be met. Portfolio holdings and/or allocations shown above are as of the date indicated and may not be representative of future investments. The holdings and/or allocations shown may not represent all of the portfolio's investments. Future investments may or may not be profitable. For illustrative purposes only. Past performance does not guarantee future results, which may vary.
Economic relationships between European companies are also remarkably complex. Unlike the US, where stocks within specific sectors often show similar return profiles, Europe exhibits greater dispersion of excess return patterns, even within sectors. Relationships between stocks are less obvious, and stocks from the same sector do not necessarily move closely together, indicating a higher network complexity. For example, a German auto parts manufacturer's success may depend not only on German labor laws and domestic demand, but also on French consumer confidence, Italian fiscal policy, Spanish supply chain logistics, and Chinese import tariffs. This intricate web of relationships makes it challenging to capture opportunities swiftly and dynamically before they erode, particularly using traditional stock analysis alone.
Slower Price Discovery
Europe's diverse, fragmented, and complex equity market structure leads to slower price discovery and persistent pricing anomalies compared to more homogenous markets like the US. This environment contributes to information traveling more slowly, leading to pricing anomalies persisting for longer. Historically, momentum-based factors have broadly demonstrated better and more persistent performance in Europe than in the US.
Investors in Europe tend to increase trading volumes around earnings announcements by a higher multiple than their US counterparts, suggesting a greater perceived informational value tied to these announcements, possibly due to lower informational coverage outside formal reports. Meanwhile, the impact of sell-side analyst revisions to earnings per share estimates decays more slowly in Europe. Namely, when the market positively (or negatively) reacts to an increase (or decrease) in sell-side analyst estimated EPS, we see that reaction persists for longer in Europe. For instance, the market's reaction to EPS revisions persists longer in Europe; after 63 days, average daily realized excess returns attributable to EPS revisions remain at 73% of their initial 5-day impact, whereas in the US, efficacy falls to 28% within the same timeframe.3 This indicates a less efficient price discovery mechanism in Europe, offering a temporal advantage for investors employing systematic data gathering to identify and act on information before its alpha potential diminishes. The fragmentation of European capital markets, with numerous exchanges and regulatory differences, contributes to these inefficiencies.
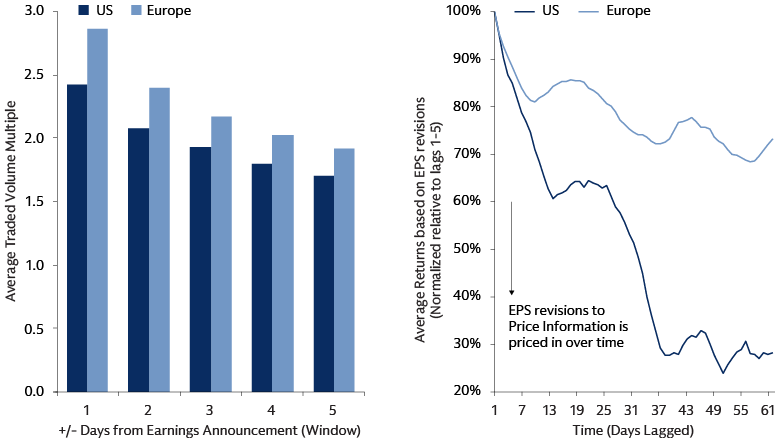
Source: Goldman Sachs Asset Management. Left: Data from January 1, 2020 through March 31, 2025, covering up to earnings season ending 31 December 2024, based on data availability. This is composed by taking the average of each underlying stock’s traded volume within the EAD window as a multiple of its trailing 60- day median volume. Right: Average returns are based on response to changes in consensus FY1 EPS estimate revision / price, considering daily return data from January 1, 2006 until September 16, 2025, normalized to 1 = mean return over lags 1-5. For illustrative purposes.
The Alpha Paradox
Europe's equity markets present a compelling paradox: while they offer a rich environment for potentially generating alpha, extracting it poses significant challenges, particularly for traditional investment approaches. This creates a situation where alpha is abundant, yet elusive.
On one hand, the characteristics of European markets, such as their diversity, heterogeneity, and slower information diffusion, create ample opportunities for skilled active management to outperform. Evidence suggests that active managers in Europe have a higher success rate in generating excess returns compared to their U.S. counterparts. While 69% of active Europe managers have achieved positive excess returns with an average of 0.82%, only 42% of active US managers have, with the average underperforming by -0.41%, as of June 2025.4 This indicates that a rich source of alpha exists, with more managers successfully finding and extracting value.
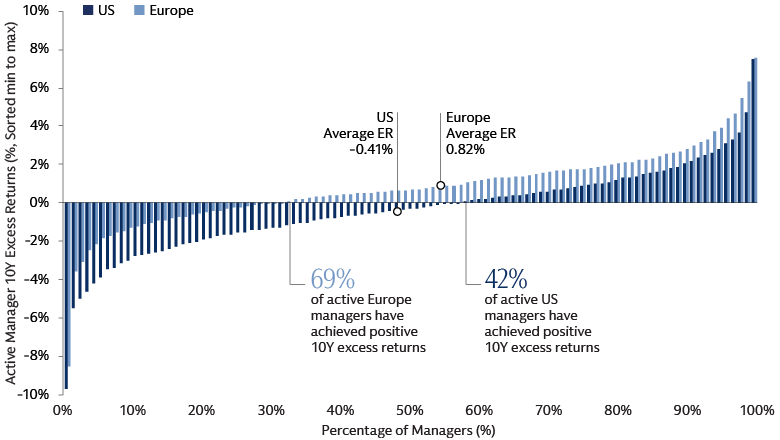
Source: MSCI, Goldman Sachs Asset Management and eVestment. As of June 30, 2025. Data retrieved on August 19, 2025. Only Active managers considered. Returns are based on USD. Europe and US represented by the All Europe Equity and US Large Cap Equity universes. Benchmarks are the manager preferred benchmark, and when Null, S&P 500 and MSCI Europe -ND respectively.
The very factors that contribute to Europe’s alpha potential also present unique challenges for certain investment approaches. The vast and diverse nature of European markets makes comprehensive coverage challenging. Complexity and often non-intuitive economic linkages driving stock returns can be difficult to fully comprehend through human analysis alone. In addition, some investment strategies may face scalability challenges, as the drivers of alpha can differ significantly across various market segments, making it hard to connect disparate approaches effectively. While slower information diffusion creates opportunities, it also means non-systematic decision-making, with slower reaction times, may struggle to capture potential alpha, thereby hindering the exploitation of fleeting market inefficiencies.
Ultimately, we believe this alpha paradox highlights the ability of advanced, data-driven approaches to effectively navigate the market and capitalize on opportunities.
Quant as a Data-Powered Precision Tool
Historically, quantitative strategies have proven highly successful in European equities, as quant managers consistently outperform passive and fundamental approaches across various time horizons,5 thereby underscoring the efficacy of these methods in such a unique market.
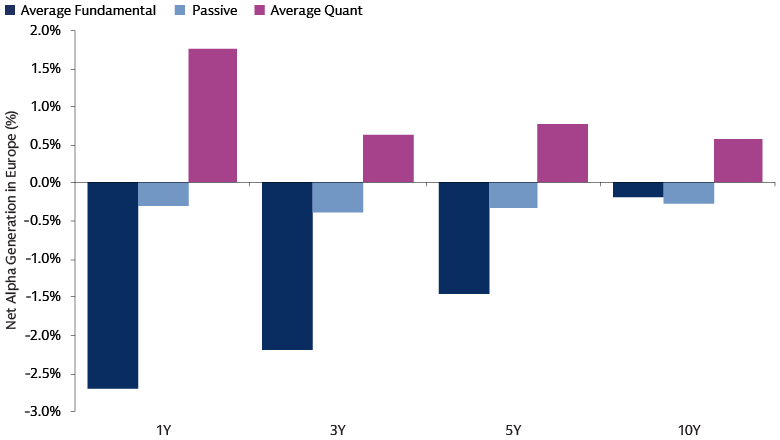
Source: Goldman Sachs Asset Management, eVestment, as of June 30, 2025. Data retrieved on July 21, 2025. Returns are based on base currency. Under primary investment approach, only passive, quantitative and fundamental strategies are used. Primary universe is All Europe Equity. The average annualized excess returns and information ratio are computed separately for passive, fundamental and quantitative managers. Figures above are arithmetic averages for those groups. Past performance does not predict future returns and does not guarantee future results, which may vary.
In our view, the effectiveness of quantitative approaches stems from several key advantages:
- Panoramic Insight: By systematically analyzing vast amounts of data, quantitative methods offer full coverage of the European equity universe, encompassing a vast universe of companies from a multitude of countries. This comprehensive view, irrespective of informational sparsity, is virtually impossible for human analysts to achieve.
- Augmented Perception: European markets feature intricate economic linkages and stock price relationships that often defy human intuition. Quantitative strategies, powered by advanced analytical techniques and machine learning, can discern multi-dimensional patterns and non-obvious correlations that drive alpha, extending beyond human cognitive limits.
- Systematic Unified View for Scalability: Quantitative strategies consolidate fragmented data into a single, actionable picture. This systematic process enables consistent application and scalability across diverse market segments, unifying insights that might otherwise remain disparate.
- Dynamism to Act Quickly: The ability to react swiftly to new data is crucial for capitalizing on temporary informational asymmetries, even in markets where information diffuses more slowly. Quantitative systems automate data collection, analysis, and execution, allowing for rapid identification and exploitation of opportunities before they dissipate, thereby capturing the temporal advantage.
In essence, while Europe's diverse and fragmented markets present challenges for traditional investment, quantitative investing provides the precision and scale needed to effectively "drill" for and extract its rich alpha opportunities.
Capitalizing on an Evolving Landscape
Europe's equity market presents compelling opportunities for alpha potential generation through fragmentation, complexities and inefficiencies, which quantitative strategies are uniquely positioned to transform into competitive advantages. This inherent alpha potential is now significantly bolstered by important drivers of beta returns. Europe's ambitious fiscal expansion plans, including Germany's proposed €500 billion infrastructure fund aimed at modernizing its infrastructure and stimulating economic growth, and increased European defense spending, are set to boost European assets and foster optimism for the Euro area's medium-to-long term economic prospects. Initiatives such as Germany's fund operating outside traditional debt constraints and projected increases in defense expenditures across the continent are expected to contribute positively to GDP growth. Furthermore, fiscal reindustrialization points to emerging investment opportunities in sectors like industrials, energy, and infrastructure. In our view, this is an especially opportune time to consider quantitative investment approaches in Europe. A powerful convergence is underway, combining substantial drivers of market beta with Europe’s distinct characteristics that favor systematic alpha extraction. These strategies are uniquely positioned potentially to identify and capture evolving sources of differentiated returns, completing the case for investing in the region today.
1Source: Goldman Sachs Asset Management
2MSCI. As of June 30, 2025.
3Source: Goldman Sachs Asset Management.
4Source: MSCI, Goldman Sachs Asset Management and eVestment. As of June 30, 2025. Data retrieved on August 19, 2025. Only Active managers considered. Returns are based on USD. Europe and US represented by the All Europe Equity and US Large Cap Equity universes. Benchmarks are the manager preferred benchmark, and when Null, S&P 500 and MSCI Europe -ND respectively.
5Goldman Sachs Asset Management, eVestment, 1, 3, 5, 10 years.
