Market Pulse February
We expect US growth to accelerate in the first half of 2026, driven by fiscal support and an improving consumer – households are projected to receive an additional $100bn in tax refunds this filing season. Meanwhile we see continued resilience in Chinese exports boosting China GDP but challenging Europe’s manufacturing sector. As a result, upcoming fiscal data on Germany’s investments in defense and infrastructure may be key.
The perception of Federal Reserve independence has become top of mind ahead of the end of Chair Powell’s term in May. While a new Chair may have a more dovish influence, policy is still set by twelve voting committee members. Given the soft labor market and normalizing inflation environment, a terminal rate of 3.0% - 3.25% seems reasonable in our view.
Investors have faced no shortage of headlines to start the year, but portfolios have remained broadly resilient. We believe this is a reflection that the economy is the most important driver for markets. Historically, when the US economy has expanded, equities have enjoyed high odds of a positive return and a greater probability of large gains than losses. Unless news impacts trade, energy, or the economy, we believe markets can continue to rally.
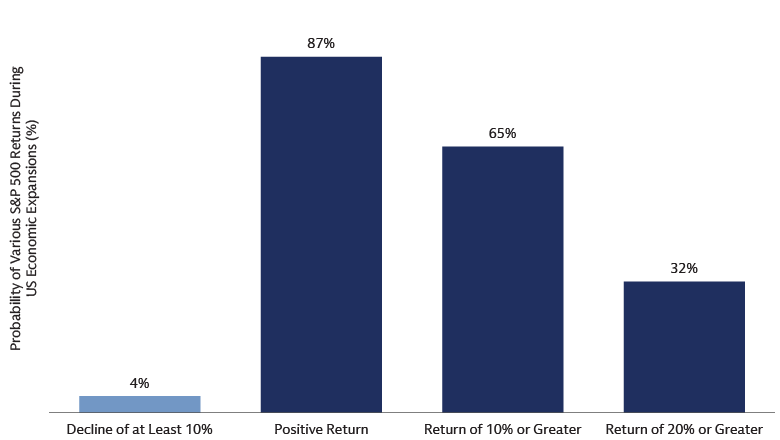
Source: Bloomberg, Goldman Sachs Investment Strategy Group and Goldman Sachs Asset Management. As of December 31, 2025. Chart shows the historical frequency of different 1-year S&P 500 total return scenarios when the US economy is growing. Chart is based on data since 1945. Past performance does not predict future returns and does not guarantee future results, which may vary. For illustrative purposes only.
Global small caps surged in January, up 5.4% vs the MSCI World’s 2.3%. Given our expectations for cyclical strength, earnings recovery, and US rate cuts, we think they can continue to deliver in 2026. However, with more than 40% of small cap companies still unprofitable, we believe a bottom-up approach will be critical.
Global long-end rates face upward pressure from fiscal and geopolitical risks while spillover effects will likely continue to be an important driver for global yields. JGBs are in focus ahead of Japan’s February 8 general election that may lead to more inflationary fiscal policy, though a policy reduction in long-end supply should help to address the recent supply/demand mismatch.
Policy uncertainty has accelerated demand for gold and after rising 65% in 2025 we think it may continue to climb. The gold market remains a small fraction of global assets, which means modest flows could have major impact. Goldman Sachs Global Investment Research estimates that every 1bp increase in gold’s share of US portfolios (currently <0.2%) lifts gold prices by 1.4%.
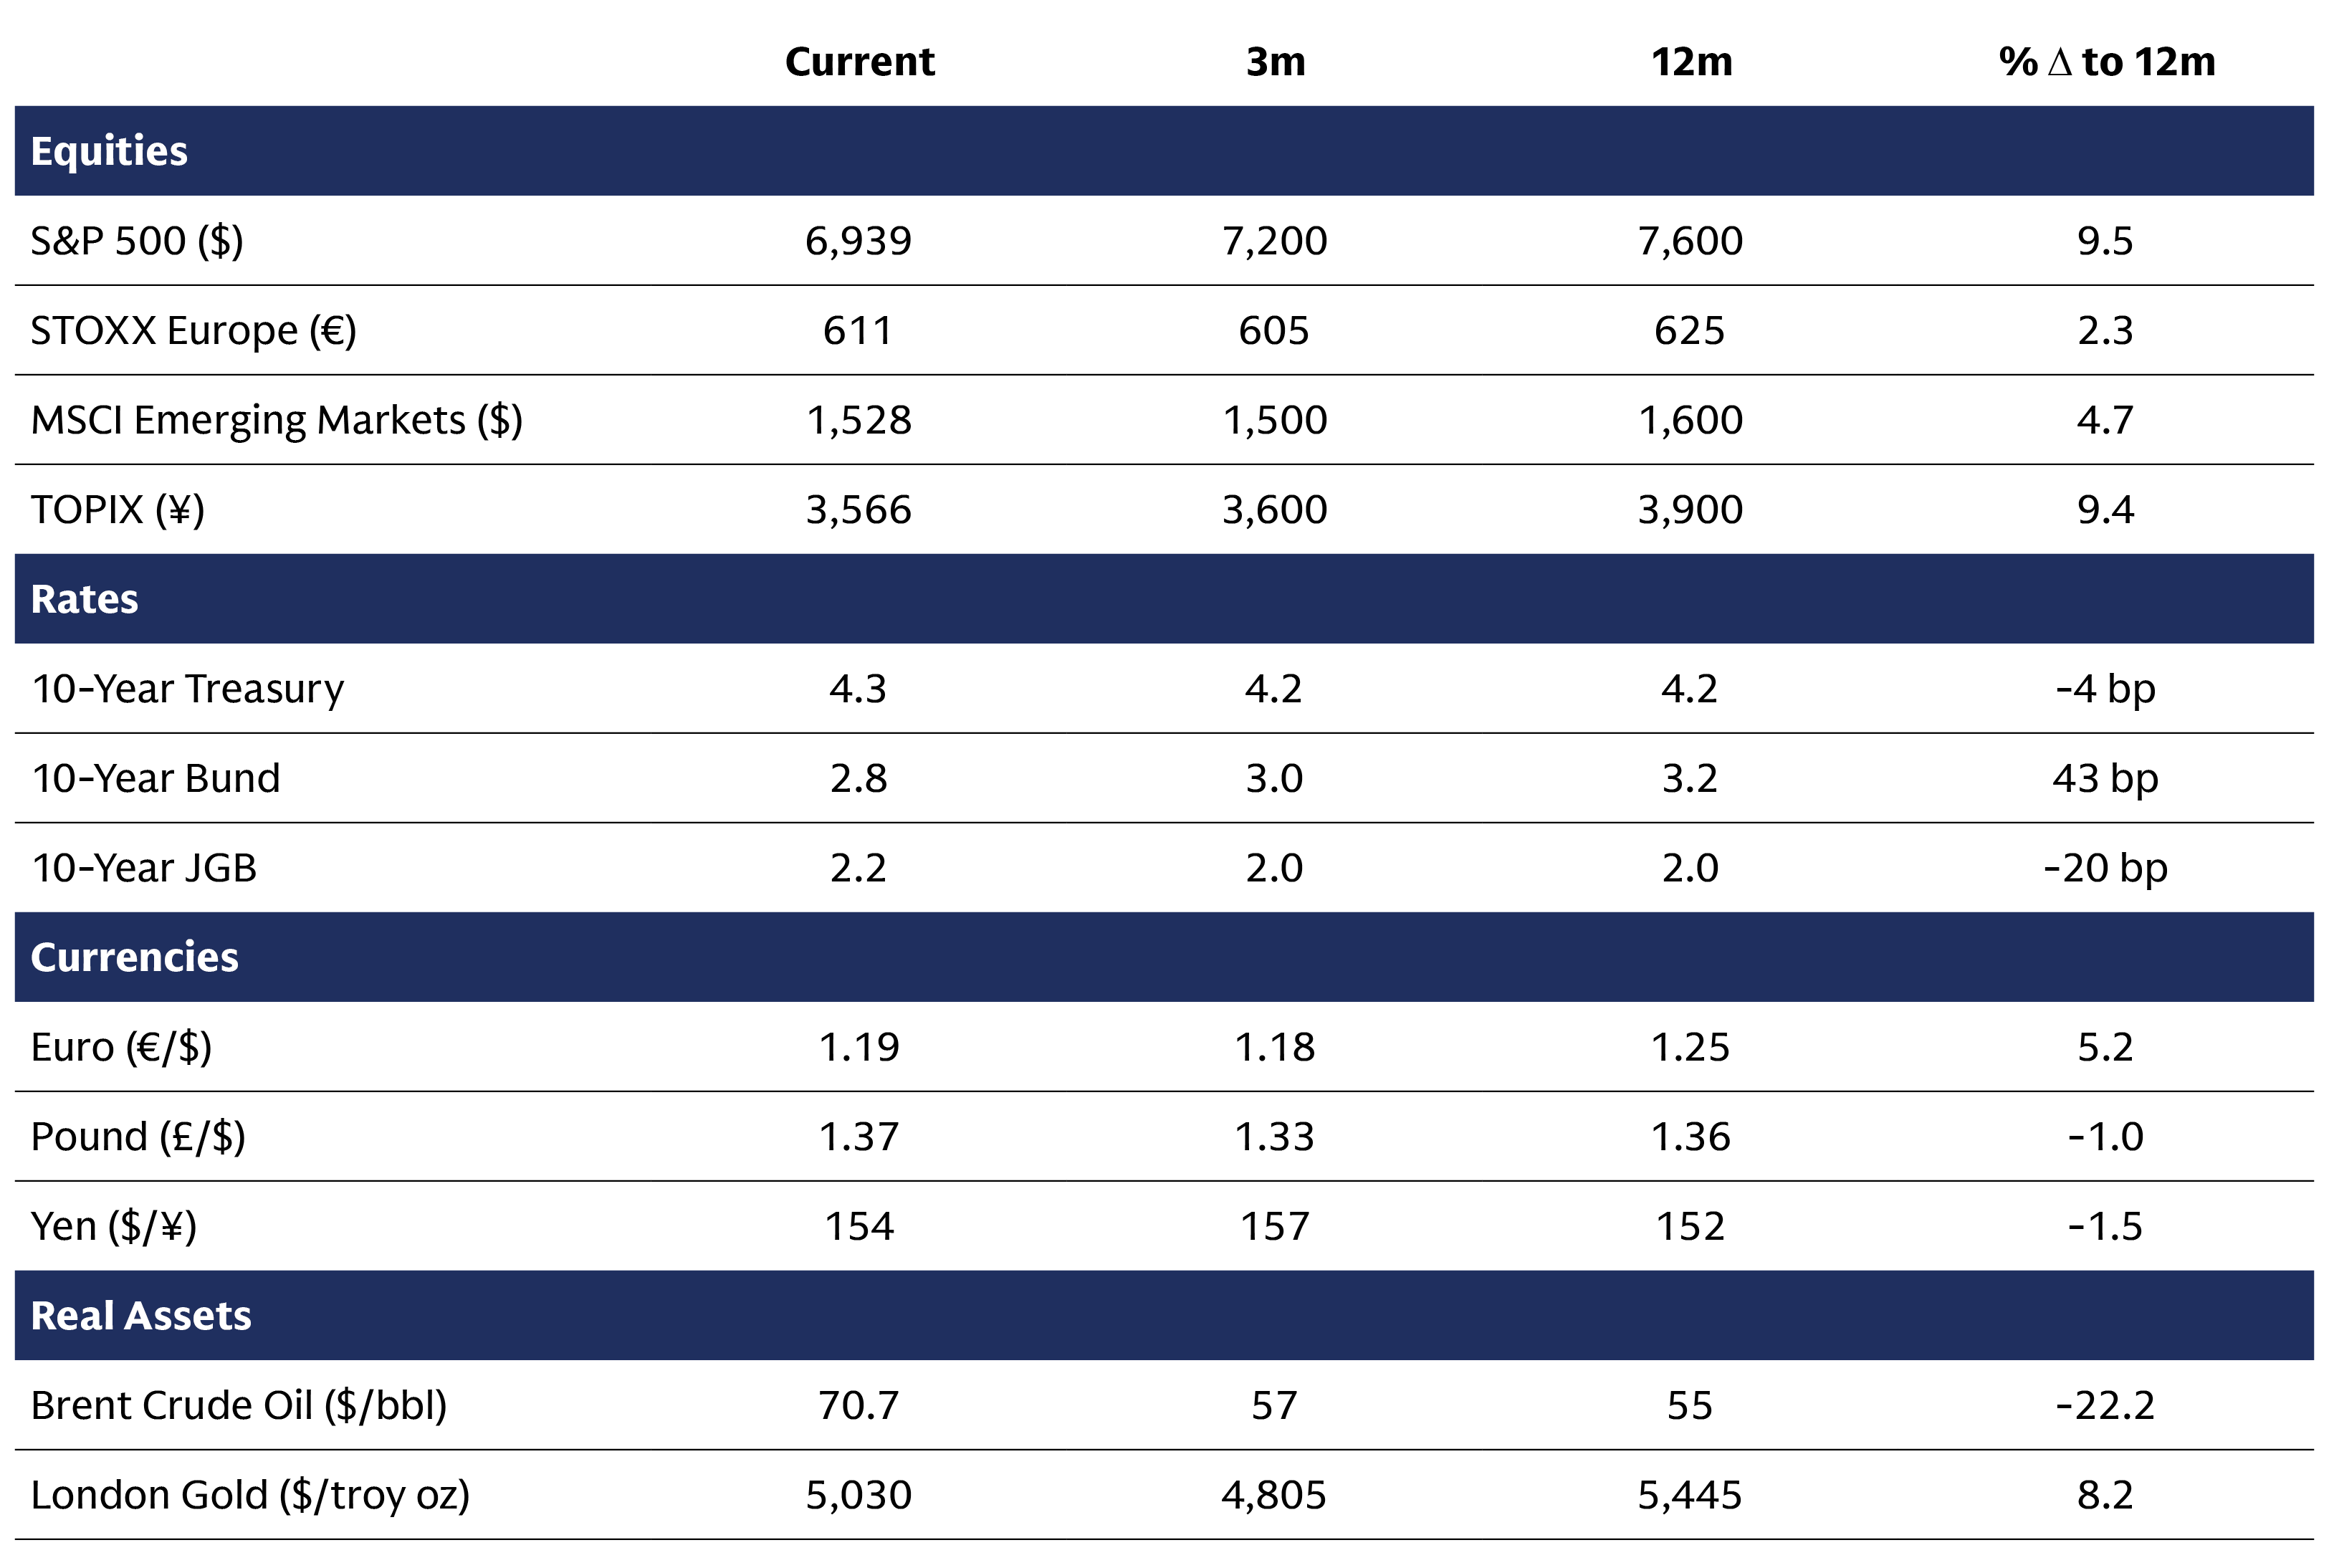
Asset Class Forecasts: Price targets of major asset classes are provided by Goldman Sachs Global Investment Research. “Global equities flat again as Brent outperforms.” As of February 2, 2026.
Global Equity Opportunities
Diversification delivered in 2025 and we remain constructive on global equity opportunities in 2026. As earnings continue to grow, we expect the bull market to broaden across regions, sectors, and capitalizations. Given elevated valuations across most markets we are mindful of potential risks and focused on the fundamentals. We expect an earnings-driven market with opportunities for alpha generation in the year ahead.
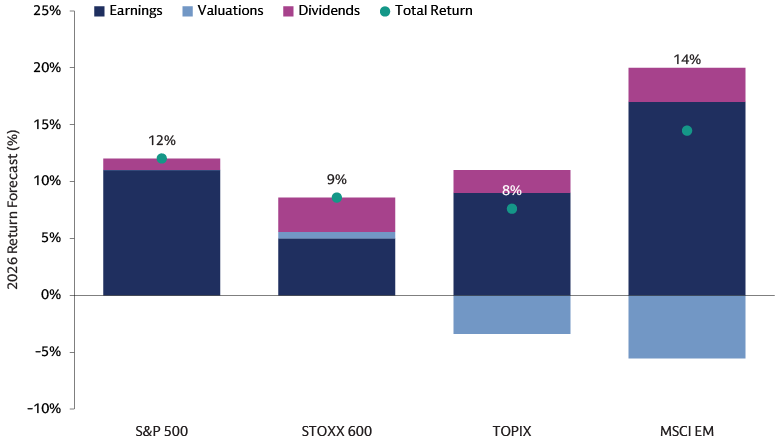
Source: Goldman Sachs Global Investment Research. As of December 31, 2025. Chart shows the 2026 return forecast broke down into earnings, valuation, and dividend components. AI refers to artificial intelligence.
We see global markets offering competitive opportunities in 2026. US equities continue to be driven by tech, though we expect the AI trade to broaden. Europe is more value-oriented and income-driven, while Japan continues to see earnings improvement on governance reforms. Meanwhile emerging markets represent a diverse mix of technology, commodity, and domestic stories across different economies.
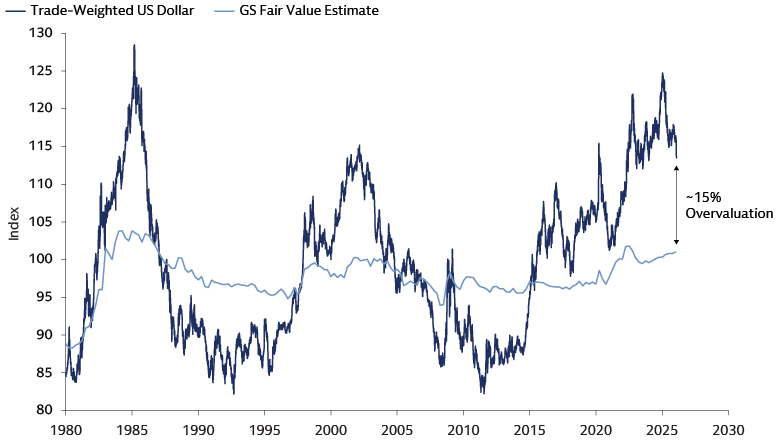
Source: Goldman Sachs Global Investment Research. As of December 31, 2025. Chart shows the GSDEER fair value model based on inflation, terms of trade and productivity differentials, versus the trade-weighted US dollar.
For US-based investors, potential dollar depreciation may be an additional source of return. Even after last year’s decline, the GS GIR fair value model estimates that the dollar is roughly 15% overvalued following the last decade of exceptional US capital market performance. As economies normalize and rate convergence continues in 2026, we see opportunities for further dollar downside in the near-term. For investors outside of the US, that may also make domestic markets more compelling.
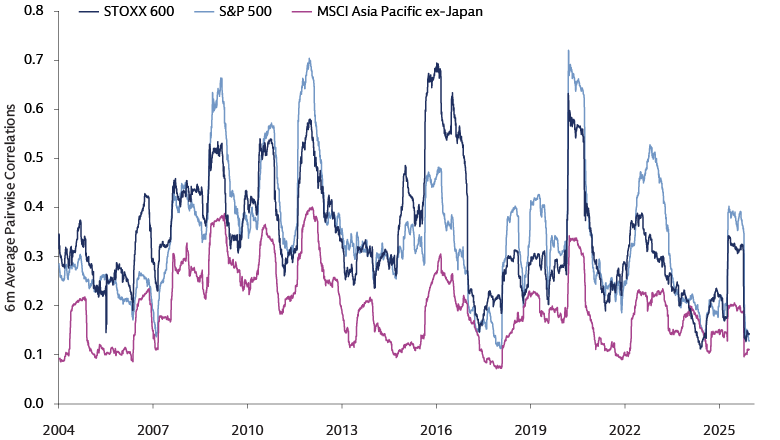
Source: Goldman Sachs Global Investment Research. As of December 31, 2025. Chart shows the 6-month average pairwise correlation between stocks in the S&P 500, Stoxx 600, and MSCI Asia ex-Japan. Past correlations are not indicative of future correlations, which may vary.
Diversification has become more valuable as correlations have fallen both within and across global equity markets. It also creates potential opportunities for stock pickers as idiosyncratic factors matter more. Going forward, we see attractive opportunities globally - particularly for quality companies that may successfully harness the secular tailwinds of new technology and/or benefit from the cyclical upswing that we expect in the year ahead.
“We/Our” refers to Goldman Sachs Asset Management. The economic and market forecasts presented herein are for informational purposes as of the date of this document. There is no guarantee that objectives will be met. There can be no assurance that forecasts will be achieved. Diversification does not protect an investor from market risk and does not ensure a profit. Please see additional disclosures at the end of this document. Past performance does not predict future returns and does not guarantee future results, which may vary.
