Five Frequently Asked Questions by Income Investors
1. Why should income-oriented investors consider equities when interest rates are at their highest level since the Global Financial Crisis?
The rapid rise of interest rates may tempt investors to go all-in bonds to boost income. However, trying to time investments in bonds over equities based on the prevailing level of bond yields has historically proven difficult. Even at starting yields above 5%, bonds have underperformed equities in every calendar year outside the tech bubble and the Global Financial Crisis over the past 30 years. To achieve long-term investment goals, investors should aim to stay balance to avoid overlooking the importance of capital growth. Thus, both capital and income growth are critical elements of a long-term income strategy, and this means exposure to both bonds and equities is required. The stocks in our Multi-Asset Income strategies have grown their dividends twice as fast as inflation over the past five years, and 3% per year faster than the broad equity market.1
Source: Bloomberg, Janus Henderson Global Dividend Index, Morningstar, Goldman Sachs Asset Management.
As of March 1, 2023. Based on dividends in local currency. Global Dividends based on MSCI World.
2. What should the equity allocation consist of, bearing in mind that dividend-oriented equity strategies have underperformed the broader market recently?
We believe it’s important to construct the equity allocation holistically by looking beyond stocks that might offer high dividend yield today, but potentially offer less total return tomorrow, as buying high dividend-paying value stocks has weighed on the performance of many traditional equity income strategies (Exhibit 3). In contrast, we invest in 50-70 high-conviction income stocks, which we complement with broad exposure to the global equity markets. This provides balance to our portfolio’s style and sector diversification, which may help its performance during periods in which the growth style outperforms. To further diversify sources of income, we complement the dividends earned by our holdings through covered call writing. A covered call is constructed by holding a long position of an equity, followed by collecting premiums from selling corresponding out-of-the money call options on developed market equity indexes, which could help achieve downside protection amid the search for upside potential.
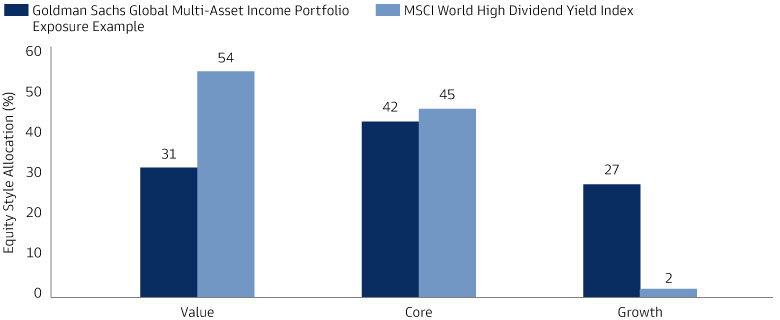
Source: Morningstar. As of June 30, 2023. MSCI World High Dividend Yield Index provided as proxy for typical income approach.
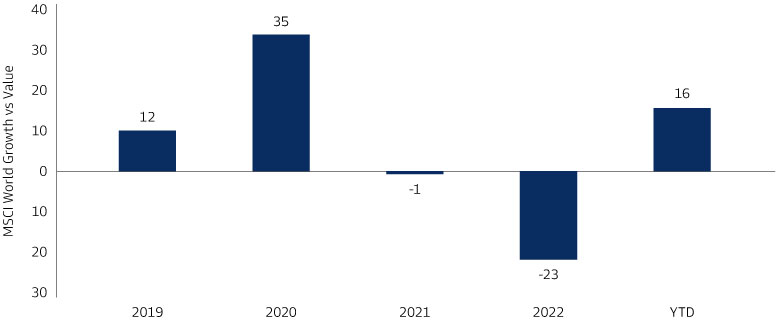
Source: Morningstar. As of June 30, 2023.
3. With high-yield corporate bonds making up a large part of most multi-asset income portfolios, how do you manage default risk?
Selectivity is vital when it comes to reducing a portfolio’s exposure to default risk. Instead of owning the full universe of high-yield corporate bonds, we aim to invest only in low-rated issuers that we’ve selected very carefully. This approach has enabled us to avoid any credit defaults in our portfolios in the past three years, while our holdings with a credit rating of BB or below have experienced just half of the credit spread widening experienced by all the bonds with equivalent credit ratings in the broad market over the past year. Given the current environment, we aim to identify issuers with resilient balance sheets and limited revenue cyclicality. We’re finding them in sectors such as aerospace and defense. By contrast, we aim to avoid companies that are sensitive to changes in discretionary consumer spending, like cruise operators and theaters, or have high refinancing needs, such as capital-intensive cable companies.

Source: Goldman Sachs Asset Management, as of February 28, 2023. Portfolio holdings and/or allocations shown above are as of the date indicated and may not be representative of future investments. The holdings and/or allocations shown may not represent all of the portfolio's investments. Future investments may or may not be profitable.

Source: Goldman Sachs Asset Management, as of February 28, 2023. Portfolio holdings and/or allocations shown above are as of the date indicated and may not be representative of future investments. The holdings and/or allocations shown may not represent all of the portfolio's investments. Future investments may or may not be profitable.
4. How does Goldman Sachs Global Multi-Asset Income Portfolio reflect your macro views?
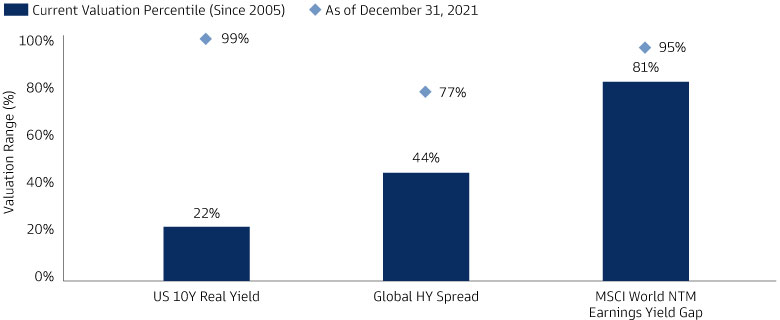
We believe the most developed markets are in the advanced stage of the growth cycle, but unlikely to contract this year due to continued resilience of labor markets. That said, growth is likely to remain below historical standards and recessionary risks are increasing with the persistence of tight credit conditions and restrictive monetary policy. Distinguishing between ‘late’ and ‘end of cycle’ is important when it comes to tactical positioning, as risk assets have historically performed well in the ‘late’ cycle phase but struggled when recessions are imminent. This backdrop means our portfolios are currently largely aligned with their long-term strategic positioning targets, but elevated uncertainty coupled with relative valuation differences mean we marginally favor government and investment grade bonds over high yield and equities. This is illustrated in the chart below, which shows how the US 10-year real bond yield now trade in 22%

Source: Goldman Sachs Asset Management, as of June 30, 2023. Valuation shown as percentiles of historical range since. NTM= Next twelve-month forward earnings. Earnings yield of equities is the inverse of P/E ratio.
5. How do Asian securities feature in your portfolio?
Our income strategies invest globally and access the Asian markets directly by investing in both local and hard-currency emerging-market sovereign debt and equities from developed Asian markets. As economies and companies today are often global in nature, we like to look beyond the location of a company’s stock listing and invest in stocks with exposure to revenue growth in Asia. Looking through the revenue lens, the companies held in our income strategies derive almost a fifth of their revenues from Asia.
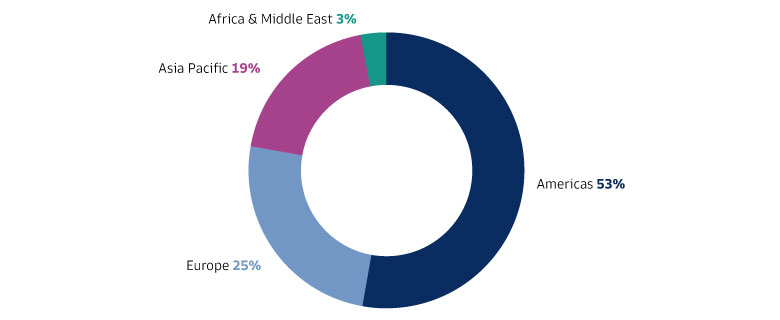
Source: Goldman Sachs Asset Management, Morningstar, as of June 30, 2023.
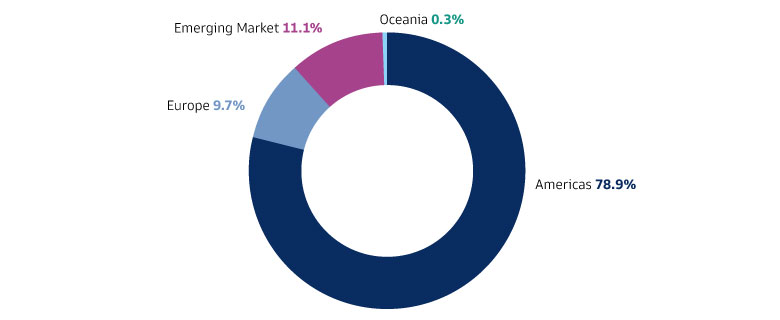
Source: Goldman Sachs Asset Management, as of June 30, 2023.
