Balancing Act: Building Private Credit Portfolios
Growing, Robust Interest in Private Credit
From corporate borrowers to loans against streaming music royalties: private credit has evolved into a diversified asset class that offers the potential for return enhancement and diversification relative to public credit investments. Having grown seven-fold since the global financial crisis (GFC), private credit now stands at $1.9 trillion in Assets Under Management.1 Encompassing a wide array of investment strategies across different risk and seniority levels, private credit can offer exposures ranging from pure credit to solutions structured as credit/equity hybrid vehicles, lending against a variety of underlying assets and borrowers. This growth and maturation, as well as greater recognition of the attractive features of private credit (including a 5% annualized outperformance over broadly syndicated loans in the past decade),2 has increasingly led investors to assign it a dedicated portfolio allocation. A recent survey of institutional investors representing $3 trillion of assets under management has found that they hold on average 5.7% of their assets in private credit, more than two percentage points below their target allocations of 7.8%.3 We expect a growing range of investors will examine the asset class more closely. Structurally higher base interest rates, compared with the past fifteen years, may make private credit yields attractive to investors with higher portfolio return targets than those of traditional private credit allocators–for example, endowments, foundations, and family offices. A dedicated allocation calls for a strategic approach to portfolio construction that considers investment exposures, sizing, and positioning.
Public-Private Parallels
Private credit strategies can play different roles in a portfolio, in alignment with the overall asset allocation. Investors can access varying positions on the credit quality spectrum, risk and return targets, yield versus growth profiles, and the degree of sensitivity to the economic cycle. We believe investors should look beyond a single, monolithic definition of private credit, employing a more granular and sophisticated approach to allocating across private credit strategies. This approach can start with a framework for classifying available opportunities. One potential framework is to draw parallels between private credit investment strategies and their closest counterparts in public markets. This framework can help define portfolio characteristics, roles, and diversification approaches for a private credit portfolio.
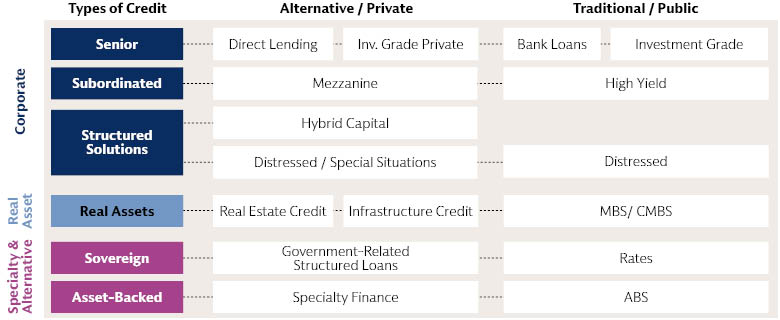
Source: Goldman Sachs Asset Management. For illustrative purposes only. As of September 2023.
Private credit strategies can be broadly classified into three categories, based on the underlying borrower and collateral type: corporate credit, real asset credit, and specialty and alternative finance. Corporate credit includes lending to companies for operations or business expansion, and to private equity managers to finance leveraged buyout transactions (LBOs). This is the largest segment of private credit ($1.5 trillion AUM) and is the core of most investors’ private credit portfolios.4 Real asset credit ($400 billion AUM) comprises lending to owners or developers of real estate or infrastructure assets for acquisition, improvement, maintenance (including refinancing), or development.5 The third segment, specialty finance, includes niche strategies that provide loans that are backed by equipment, future revenue streams like royalty payments, or financial asset pools such as consumer lending and investment fund financing. This segment forms a small part of assets under management, but we believe it is a growing segment of the market. Rapid innovation in data and financial technology has allowed lenders to evaluate, underwrite, and price often-complex instruments more robustly.
The key components of return, and their associated key risks, can be grouped across the spectrum of private credit strategies. These return components contain elements of both market beta (broad market exposure) and manager alpha (manager-specific return), with the balance differing by strategy as well. Beta exposures generally form the core of an allocation to a particular asset class as they offer access to desired sources of return. Alpha is opportunistic and dependent on implementation and manager selection.
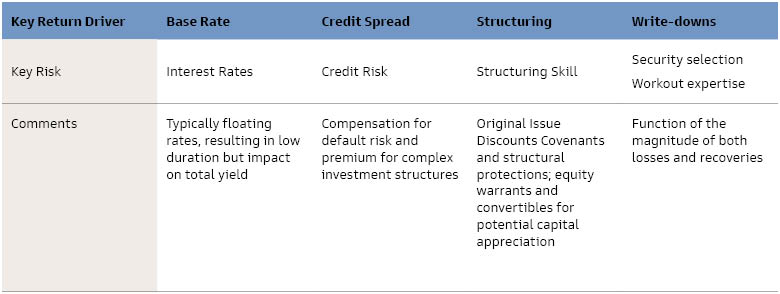
Source: Goldman Sachs Asset Management. As of September 2023. For Illustrative purposes only.
The base rate (typically the Secured Overnight Financing Rate) is pure beta, compensation for the time value of money. The credit spread over this base rate has elements of market-wide levels (beta) and manager-specific premium (alpha). This alpha may come from loan parameter customization associated with more complex businesses, assets that require meaningful skill to accurately underwrite, or the ability to offer one-stop solutions in size. Structuring likewise has both beta and alpha components. Loan covenants and structural protections act as a source of potential credit alpha. Investment structures that offer potential equity upside, such as warrants and convertibles, represent equity beta exposure while also offering the potential for alpha (this is the case particularly in structured solutions). Finally, write-downs, or the avoidance thereof, represent the largest alpha-based opportunity. They reflect the investment manager’s skill in minimizing defaults and maximizing recoveries.
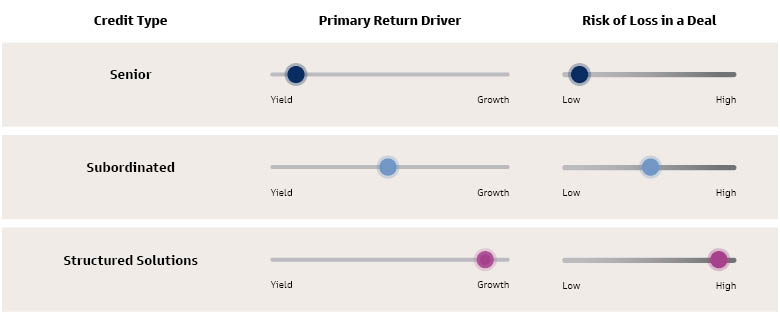
Source: Goldman Sachs Asset Management. As of September 2023. For illustrative purposes only.
Private credit portfolio construction may not easily lend itself to relying exclusively on traditional mean/variance portfolio construction techniques. Loans are typically held to repayment and periodic marks are subject to manager discretion. This means periodic volatility may not ultimately reflect the main risk of the asset class, which is loss of capital. For some specialty finance strategies, the dearth of historical data means that a robust risk assessment may not be available. Returns in private credit are not normally distributed—especially in senior credit, where the upside is limited, and asymmetry is to the downside. Fund-level leverage, which is used frequently by private credit funds, magnifies the asymmetry. In addition, fund-level leverage enables an investor to achieve a similar level of return in various ways. For instance, a levered senior credit fund can achieve a similar yield as an unlevered mezzanine fund. However, the two funds would have different risk compositions, even if a selected risk metric like expected “Value at Risk” is similar. Therefore, these two investments are not interchangeable.
We believe diversifying across the underlying sources of risk is an important part of risk management in private credit portfolio construction. This includes evaluating the nature of risks in each strategy and the tradeoffs the investor wishes to make among them.
Investing across the capital structure can be an intuitive way of diversifying underlying beta exposures. Performing credit tends to move with the economic cycle, with junior credit more sensitive to the cycle than senior credit. Distressed and opportunistic strategies may be counter-cyclical, finding a greater number of attractive investment opportunities when the economy is challenged. Hybrid capital opportunities may be less cyclical, with opportunities across market environments.
Diversifying across borrower type can be another risk management strategy. Different underlying collateral types may have different sensitivities in a particular economic environment. Real estate or infrastructure assets will not move perfectly with the corporate cycle. In infrastructure, for instance, many assets are engaged in providing essential services—transportation, energy, waste management—that are less sensitive to the overall economy. In real estate, demand for residential multi-family property is sensitive to the health of the economy, but sector-specific supply factors have offset some of this sensitivity in the current cycle. Sectors such as senior or student housing and specialized life sciences offices may be beneficiaries of demographic trends that transcend the cycle. In specialty finance, the idiosyncratic nature of many loans and underlying collateral assets make for lower sensitivity to the economic cycle and lower correlations to other investment strategies
Diversifying across these three segments will not diversify away all risk. The various strategies are not uncorrelated; rather, they are imperfectly correlated to each other. Some systematic return drivers, such as overall credit availability and risk appetite, are related to the broader economy and therefore shared across investment strategies.
Implementation: How Concentrated Should Portfolios Be?
If asset allocation is largely about accessing desired beta exposures, manager selection focuses on the strategy for generating alpha. The ability of a private markets Limited Partner (LP) to influence investment results after the initial capital commitment is, as the term implies, limited. A well-honed implementation strategy can be a key risk management tool.
Most investors appreciate that careful investment manager selection is an important determinant in ultimate program outcomes. Distinct skillsets are required from managers underwriting different credit strategies and at different parts of the credit spectrum. Experience through full market cycles is a potential differentiator in an asset class where the number of managers has grown significantly since the last recession. Experience can help private credit managers to navigate defaulted credits and renegotiate defaulted loans in workout agreements. Scale can improve the lender’s negotiating position in workout situations. It can also strengthen sourcing pipelines—a factor that should become more important for maintaining high underwriting standards, in our view.
How many managers should private credit investors choose? All private markets investment managers (general partners or GPs) generate excess returns, either positive or negative, relative to the investment universe. Some of this excess return comes from holding fewer or different positions than the benchmark. The rest is skill-based, systematic value-add (or value destroyed). The variability of alpha across funds represents idiosyncratic risk. The more managers an LP invests with, the more this idiosyncratic risk can be diversified away. But diversification means curtailing the potential positive alpha as well as mitigating potential negative alpha. Furthermore, there are limits to the benefits of incremental diversification. The costs of the additional program complexity will at some point outweigh the benefits. These costs can be direct (e.g., smaller commitments tend to garner fewer fee discounts) and indirect (e.g., a greater number of investments require more resources to manage and monitor).
To evaluate these costs and benefits, investors may want to consider the alpha and beta components of the underlying investments as well as managers’ typical approaches to diversification. It is our view that LPs should remember that GPs are solving for the risk-return objectives of their own portfolios, not the portfolio of any particular LP. LPs must actively solve this for their own portfolio construction objectives.
In senior credit, a meaningful portion of return is beta-driven, with rate and spread betas dominating returns. Minimizing write-downs is the main source of alpha dispersion. Structuring upside is typically limited, and the potential for write-downs means there may be more downside risk than upside risk. A more-diversified portfolio can be a prudent approach from the perspective of the GP. It can mitigate losses from individual credit investment in return for relinquishing little upside. It is not uncommon for a senior credit fund to hold 50-100 positions over its life, which limits performance dispersion at the manager level. The chart below shows the dispersion of returns of simulated senior credit portfolios, randomly selected from the universe of funds in the Preqin direct lending universe. This dispersion is meaningfully lower than for other private asset classes. For instance, the intra-quartile dispersion across senior private credit managers in a given vintage year has been 0.1-0.3x over the past decade, compared to 0.7-1.1x for buyout managers. Dispersion in senior credit drops meaningfully as a portfolio diversifies to 5-7 funds; beyond that, diversification benefits trail off. Spreading out these fund commitments across multiple years can be a proxy for diversifying exposure across economic environments. As such, the data implies that making 1-2 new fund commitments per year would have captured most of the diversification benefits. One caveat is that the benign credit environment of the past decade is likely to have depressed downside risk. In fact, upside dispersion has exceeded the downside in the more concentrated portfolios. This is potentially a function of the amount of fund-level leverage or more junior/second-lien exposure chosen by the funds that generated outlier returns, as well as inclusion of funds with a mandate across the capital structure in the direct lending universe. Given our expectations of greater downside dispersion in the next decade, increasing the number of commitments to 2-3 per year may be prudent for investors focused primarily on limiting downside risk in senior credit strategies.
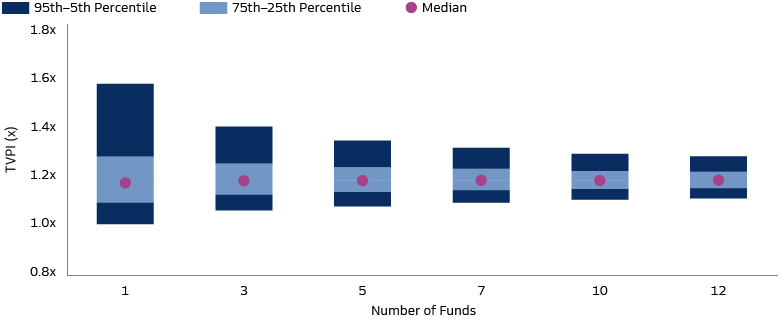
Source: Preqin, data accessed July 2023. Funds of vintages 2009-2019, excludes funds with AUM<$100M. For illustrative purposes only.
In junior credit, an LP may wish to have greater diversification at the program level. In these strategies, return drivers are more balanced between beta and alpha. Upside and downside risk are more symmetrical as well. The structuring component offering upside participation but a subordinate capital position meaning potentially larger losses. Funds specializing in junior and opportunistic credit tend to be more concentrated and typically hold 30-60 positions. A number of factors may help explain this dynamic. The universe of junior credit opportunities is smaller than that of senior credit. In leveraged buyouts, for instance, the majority of debt financing is senior, first-lien. Senior tranches for larger issuances may involve two or three lenders participating in a single financing transaction. In contrast, mezzanine issuance most often involves one lender. The diligence and structuring burden may be higher as well in junior and opportunistic credit, given the higher risk and upside nature of the strategy. Furthermore, with more upside (alpha) possible in these strategies, fund managers—who are incentivized through performance fees—are mindful of not diluting away their alpha potential by over-indexing on loss avoidance. In our view, diversification should also extend to include a variety of borrower types. This is particularly important in junior and opportunistic strategies, where the probability of default is higher. A more diversified borrower base can mitigate the chance of significant losses from exogenous market or economic factors. This implies allocating across a greater number of private credit managers in this part of the risk spectrum. An analysis of Preqin fund data shows that a portfolio of 12 junior credit funds has had a similar degree of dispersion as a portfolio of five senior credit funds.6 This suggests three to four new commitments per year in junior credit – more than in senior credit, but fewer than an analogous analysis would suggest for private equity strategies.
Because of the wider variety of strategies, approaches, and risk profiles in junior credit compared to senior credit, manager weights can vary by strategy. This can be a function of the risk profile of individual strategies as well as the LP’s conviction in the respective managers.
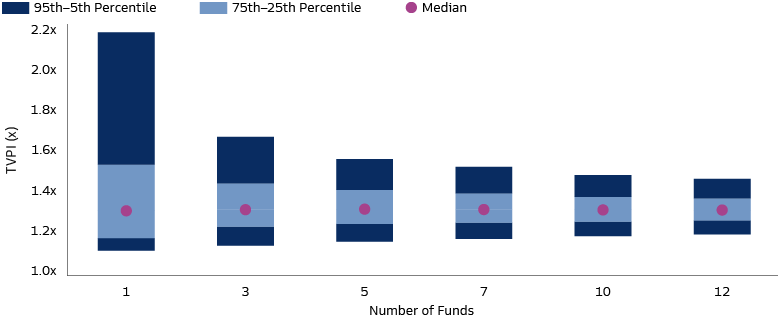
Source: Preqin, data accessed July 2023. Funds of vintages 2009-2019, excludes funds with AUM<$100M. For illustrative purposes only.
The amount of available data on non-corporate credit does not allow for a similarly robust statistical analysis. Investors in these strategies may need to consider additional parameters. For instance, the real estate market has experienced a significant realignment, with a bifurcation across property types, sectors, and tenant types (e.g., corporate vs. individual vs. institutional). In sectors like office, this realignment may mean that broad beta exposure is likely to lead to losses. At the same time, bifurcation between new, sustainable, digitally-enabled assets and older assets without these features means a greater potential for alpha. A more concentrated portfolio of real estate credit, with careful underlying asset selection, may be better positioned to avoid losses than a more diversified, beta-oriented approach.
Specialty credit presents a smaller opportunity set, with typically smaller fund sizes. Many strategies have highly idiosyncratic risk profiles and relatively short track records. These strategies may warrant smaller allocations. Investors can approach this market segment as a satellite allocation to complement the corporate and real asset credit. Practically speaking, since this is still a developing part of the market with few long-term participants, it may be challenging for an LP to fill a specific dedicated allocation on an annual basis with institutional-quality managers. This implies a more opportunistic or broad-based approach that allows additional flexibility.
Evolving Opportunity Set
The universe of private credit strategies continues to grow and evolve. Private financing has become increasingly important for real estate and asset finance. We believe this offers potential for further segmentation into senior and junior strategies, or along asset-type or investment-style lines. A nascent private investment grade market has been developing, largely supported by insurance companies seeking improved yield on their high-quality credit portfolios. New specialty credit strategies, such as fund financing, have been gaining traction. Others, such as venture lending, are increasingly becoming viewed as conventional strategies. Investors will need to adapt their allocation frameworks to take advantage of these new opportunities as these strategies continue to grow and differentiate.
1 Preqin. AUM for private credit (excluding funds of funds), real estate debt and infrastructure debt. As of December 2022, compared to December 2008.
2 Cambridge Associates, as of 12/31/2022. The Direct Alpha methodology calculates the fixed spread (Direct Alpha) that would need to be added to an index’s total return in order for the cash flows of the private market strategy, if invested in the index at the same time and amount as the private market strategy, to yield the same residual value as the private market strategy at the valuation date. Direct Alpha will not equal the difference between the IRR of the private market strategy and the returns of the index over the same time period due to its accounting for the timing and size of cash flows invested and received from the private market strategy over time, and rather represents the performance generated relative to the index only for the time period in which the capital was invested. This calculation does not adjust for leverage, hedging, or other risk factors that may be present in the private equity investment. Unlike public equity investments, private equity is illiquid and may not be readily sold for its stated value. Positive direct alpha indicates outperformance compared to the index return, and negative direct alpha indicates underperformance. Private credit direct alpha vs. the LSTA Leveraged Loan index.
3 Preqin, as quoted in Goldman Sachs Global Investment Research, “Private Credit: Assessing growth opportunities for Asset Managers.” As of June 2023.
4 Preqin. As of September 2023.
5 Preqin. As of September 2023.
6 Preqin. As of July 2023.
