Choose Your Vehicle: A Closer Look at Private Market Fund Structures
Understanding The Trade-Offs
Evergreen fund structures for private markets are enjoying significant momentum, with assets under management standing at over $320 billion across US- and EU-domiciled funds.1 Initially designed to better address the needs of individual investors, these structures are increasingly being considered by institutional investors as well. With these structures offering better liquidity, ease of implementation and immediate asset class exposure, investors are wondering, are these structures just better?
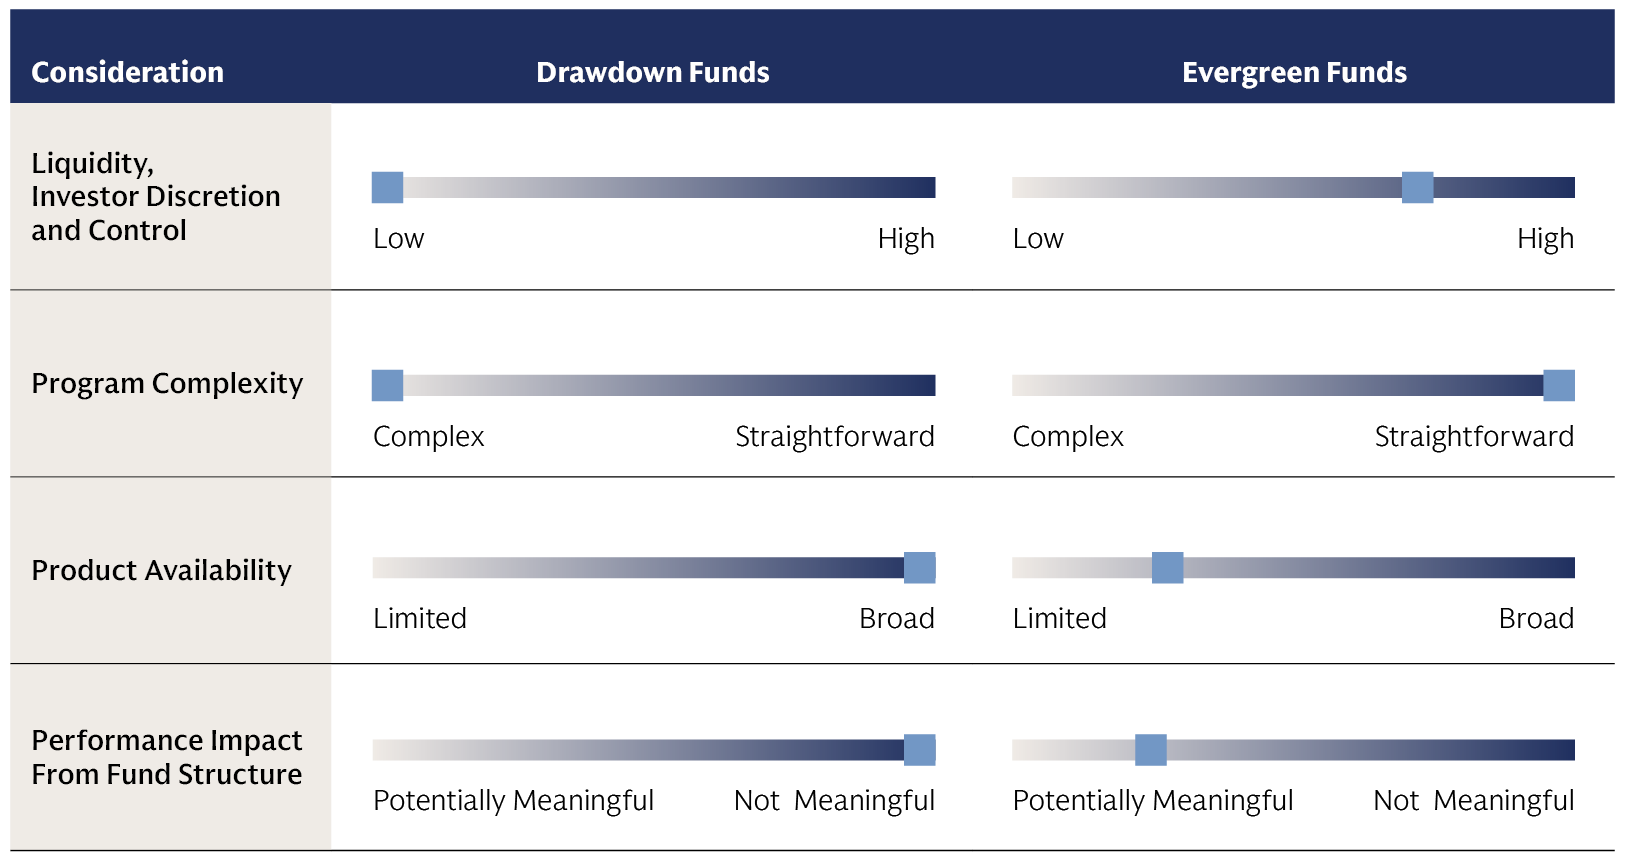
We do not believe that there is a universal “best” choice. Rather, the decision involves a set of trade-offs along four key dimensions: liquidity and investor control; program complexity; product availability and access; and performance impact. Evergreen funds are advantaged along the first two dimensions, while drawdown funds are advantaged along the last two. The best choice (or combination of choices) will vary for each investor, based on time frames, relative importance of underlying features, and resources available to manage their private markets program.

Source: Goldman Sachs Asset Management. For illustrative purposes only.
Liquidity | Advantage: Evergreen funds
Most investors understand that drawdown funds are highly illiquid. The structure is designed to match the fund’s liquidity profile to that of its underlying investments. Once capital is called, it is locked up and unavailable to the investor for several years. Liquidity comes from distributions, which are at the discretion of the fund manager and reflect portfolio cash flows: yield (where applicable) and realizations from investment exits. The largest distributions tend to start at the end of the investment period and continue until the end of the fund’s life. Most capital is returned within the first 8-12 years; some strategies can take several more years to distribute all proceeds.
In evergreen structures, investors have better liquidity and significant, but not full, discretion over their investment. Investors can choose when to enter and exit the investment. Monthly or quarterly subscription windows and quarterly redemption windows are typical, with some advance notice required for redemptions. In addition to better liquidity, this structure gives investors better flexibility to adjust their private markets exposures up or down, compared with drawdown fund structures. Fund redemptions are the main source of liquidity. Periodic distributions reflect the yield (where applicable) generated by fund assets, but proceeds from asset realizations stay in the fund and are reinvested into new opportunities. Fund managers can institute subscription queues (to help ensure orderly, disciplined cash deployment) as well as redemption gates. Redemption gates limit the amount that can be redeemed in a given period: 5% of fund assets per quarter is a typical maximum. Gates help avoid asset liquidation at unfavorable prices to meet liquidity requests, balancing the interests of the redeeming shareholders and the ones staying in the fund. However, gates are most likely to be triggered when investors most seek liquidity. As a result, investors should consider these funds to be semi-liquid.
Complexity | Advantage: Evergreen funds
One of the key benefits of evergreen funds is that they obviate much of the complexity of achieving, maintaining, and managing a private markets program over time. This complexity is a real, albeit indirect, cost, and varies by investor.
At the fund level, drawdown funds introduce investor eligibility requirements and complex tax reporting—features important for individual investors but less so for tax-exempt institutions. Drawdown funds also employ a different performance reporting metric, internal rate of return (IRR), than the rest of the portfolio, which reports time-weighted returns (TWR). In many ways IRR is a more challenging metric: it cannot be easily computed from the IRRs of underlying components (either portfolio constituents or by compounding quarterly returns). IRR and TWR metrics may yield different returns for the same underlying set of cash flows, sometimes by a meaningful amount. This makes IRR-based returns hard to integrate into the overall portfolio, and performance comparisons across asset classes difficult.
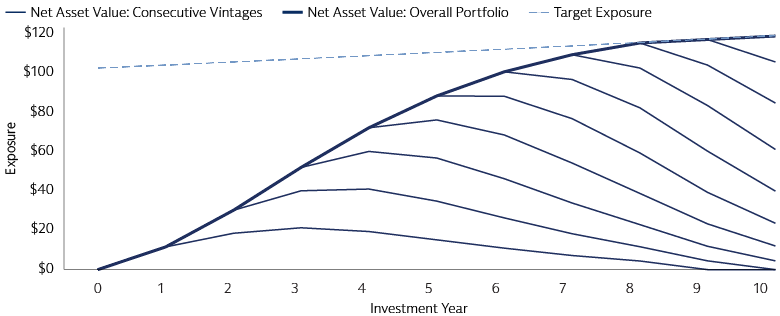
At the program level, the use of drawdown funds makes for a complex process to achieve and maintain the target allocation. These funds have finite life spans; net asset value (NAV) ramps up during the fund’s investment period and subsequently declines as assets are sold. Investors cannot achieve a steady-state private markets program via a single drawdown fund, or a single investment entry point. Achieving steady-state exposure is a multi-year process of consistently making new commitments each year. A new program may take 7-10 years to reach its target. Once the program is in steady-state, newer funds replace older ones in the portfolio, reinvesting their proceeds into new private markets opportunities to compound capital over time. However, the onus is on the investor to set a commitment pace, identify new funds on an ongoing basis, and manage cash flows and uncalled capital. In a mature portfolio, distributions from older funds can finance capital calls from younger vintages. However, even mature programs may experience a mismatch between distributions and capital calls over shorter time frames, necessitating ongoing liquidity management.
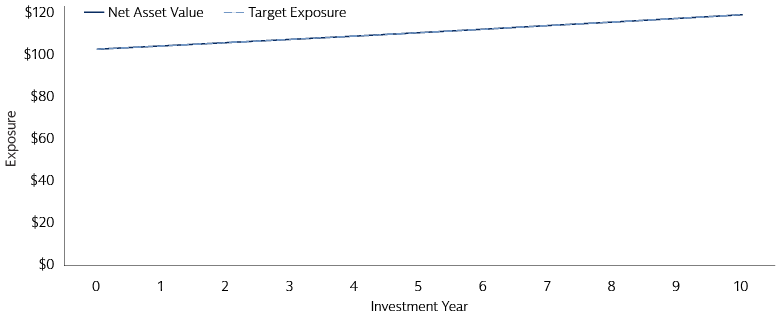
Evergreen funds substantially simplify this process for their investors. They offer consistent exposure to the asset class over the life of the investment and take on the responsibility for reinvesting proceeds from realized investments to compound capital over time. The main responsibility for the investor is to monitor and rebalance the position periodically, so that the amount in the fund remains at the target—similar to managing the allocation to any other asset class. The liquidity profile of evergreen funds also simplifies rebalancing to asset class targets and ranges.


Source: Goldman Sachs Asset Management. For illustrative purposes only.
Product availability and access | Advantage: Drawdown funds
Drawdown funds have high investment minimums, making them less accessible to smaller investors. However, for investors able to meet these minimums, the fund universe is extensive, with thousands of new funds coming to market each year across a variety of underlying strategies.2 This enables investors to diversify across strategies, geographies, and managers, with appropriate levels of manager selectivity.
Evergreen funds are broadly accessible, with investment minimums of as little as $1,000. However, the number of funds is currently limited. The universe of US-domiciled evergreen funds, for instance, numbers around 200 as of this writing, of which around 120 are at scale. The number differs across asset classes; currently the universe of private credit funds is significantly larger than the universe of private equity funds.3 This introduces considerations about achieving asset class exposure while managing manager concentration risk. While the universe of evergreen funds continues to expand, we do not anticipate that it will approach the scale of the drawdown fund universe in the foreseeable future. In our 2023 private markets diagnostic survey, the majority of general partner (GP) respondents indicated no plans to offer liquid or semi-liquid funds.4 The scale and organizational resources required to profitably operate and manage registered funds with periodic liquidity requirements may preclude many GPs from offering these vehicles, and may skew the manager universe towards larger, more diversified GP platforms. This may have implications for the universe of underlying companies in the portfolios. In addition, a perpetual fund structure lends itself less well to strategies in which opportunities are not consistent over time.
Performance | Advantage: Drawdown funds
The structural features that advantage evergreen funds in terms of liquidity and complexity also introduce a potential drag on performance. Reported performance will differ along three key dimensions. Investors should understand them all in order to properly assess and compare returns.
- Portfolio composition. In drawdown funds, all assets are invested in private holdings. In evergreen funds, the need to provide periodic liquidity means managers hold some cash and publicly traded securities (typically credit instruments featuring steady yield). These assets tend to generate lower returns than the fund’s private markets assets, creating a drag on overall fund returns. The magnitude of the drag depends on the size and composition of the liquidity sleeve, as well as the underlying private asset class. For instance, it is likely to be higher in private equity than in private credit—the return difference between private equity investments and cash/liquid credit is greater than the return differential between private and public loans.
- Fee structures: Fees are charged on different bases in the two fund structures. As such, the total level of fees can differ, creating a larger fee drag for an evergreen fund relative to a drawdown fund. In drawdown funds, management fees are typically charged on committed capital during the investment period, switching to being charged on invested capital thereafter (in some strategies, management fees are charged on invested capital throughout the life of the fund). Charging on invested capital means that management fees are only charged on the cost basis and decline over time as investments are harvested. By contrast, evergreen funds typically charge management fees on the NAV of fund assets, which includes the original investment cost basis plus appreciation of assets in the fund. In drawdown funds, carry is paid on realized returns, typically after the cash-on-cash return has exceeded a hurdle rate. Carry therefore peaks in the middle years of the fund’s life and declines as the value of remaining investments declines. In evergreen funds, carry is typically charged based on the total return (realized plus unrealized gains). This means that carry is charged more consistently throughout the life of the fund and grows over time as NAV grows. The headline level of fees tends to be lower in evergreen funds than drawdown funds, offsetting some of the dynamics of charging on a higher capital base. Extending the analysis to a program level, however, shows that for a steady-state program, fees comprise a similar proportion of overall program NAV in both fund structures.
- Return calculation methodology: As discussed earlier, the difference in methodology between IRR and TWR calculations means that the same set of cash flows and NAV patterns can result in different reported return figures. A return comparison should consider both structures on the same footing.
An analysis assuming the same underlying private assets in each fund structure suggests that a drawdown structure may offer 2.25-2.75% more annualized net return (time-weighted) than the comparable evergreen structure in private equity. The corresponding difference in private credit is 1.5%-1.75%.5
On the other hand, in a drawdown program, uncalled capital creates a drag on overall portfolio returns. This impact is most relevant in the early years of the program, before the program approaches its target and becomes self-financing (distributions from earlier vintages funding capital calls from newer ones). The impact will also vary based on the approach to managing uncalled capital. An active approach can help mitigate performance impact.
Going Head-to-Head: Evaluating An Investment Program
We believe the question of vehicle structures should be considered in the context of achieving the investor’s ultimate goal—an ongoing, steady private markets investment program. The comparison, therefore, should be between such programs, rather than between single funds. A well-structured program includes elements of reinvestment and rebalancing to maintain exposure at or near target. A comparison of a single drawdown fund with a single evergreen fund misses the reinvestment dynamics of the former implementation option and the rebalancing dynamics of the latter.
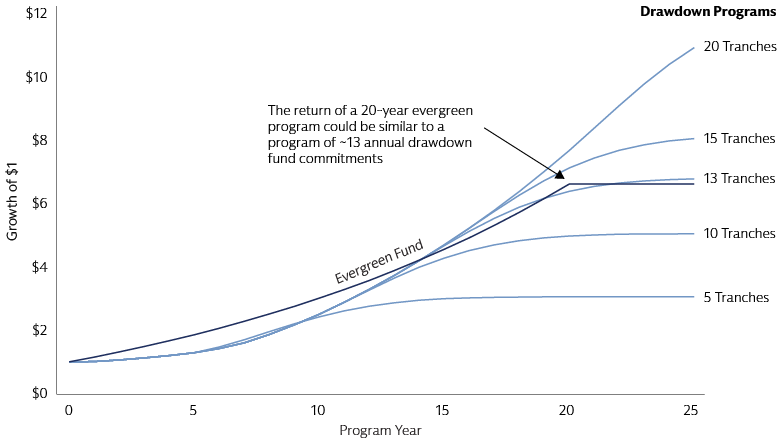
Our model, as illustrated in the chart below, analyzes a drawdown and evergreen program for private equity. The evergreen program assumes that the fund is held for 20 years, with exposure rebalanced annually to maintain the desired allocation as a percentage of the overall portfolio. The fund is subsequently sold. The drawdown program consists of annual commitment tranches, sized so that the program’s NAV reaches and subsequently remains a constant percentage of the overall portfolio.
This analysis can help quantify the performance impact of the fund structure choice and suggests several questions to answer, to help the investor arrive at their preferred implementation strategy.
The first question is the investor’s time horizon for their private markets journey. The evergreen program achieves better returns in the first few years of the program, as it is fully invested right away, foregoing the j-curve inherent in drawdown funds. However, over time, the drawdown program generates better returns, the j-curve effect more than offset by fund performance dynamics. The analysis can suggest a breakeven point for returns. For instance, as our model displays, a 20-year private equity evergreen program would achieve a similar return as ~13 drawdown fund tranches (with sensitivity to underlying assumptions). A program of additional annual commitments, e.g., 15-20 total tranches, should come out ahead.
The second question can be an explicit cost/benefit analysis. The excess return of the 20-tranche drawdown program over the 20-year evergreen program can be compared to the investor’s incremental costs of implementing the drawdown program.

Source: Goldman Sachs Asset Management. For illustrative purposes only. These assumptions are for illustrative purposes only and are not actual results. If any assumptions used do not prove to be true, results may vary substantially. The projected evolutions of drawdown funds are calculated using an implementation of the cash flow model described in the paper “Illiquid Alternative Asset Fund Modeling” by Dean Takahashi and Seth Alexander of the Yale University Investments Office, published in the Journal of Portfolio Management (Winter 2002). The projected evolution of evergreen funds is computed by compounding the initial investment by the evergreen fund’s annual net return figures. The evergreen program exposure is rebalanced so that the NAV remains a constant percentage of the investor’s overall portfolio. The drawdown funds’ commitment pacing is determined so that the program NAV remains a constant percentage of the investor’s overall portfolio.
For investors who may have the resources to do a portion, but not the entire, private markets program in drawdown funds, a third question can be, how are those resources best spent?
One potential approach, in this scenario, is to construct a core/satellite private markets allocation. Evergreen funds can offer core exposure to a diversified, multi-sector portfolio of private equity-backed companies. These funds tend to be more diversified than drawdown funds, because of their perpetual life span and likely larger target sizes. As such, we expect them to have less manager-specific risk (performance dispersion)—attractive features for a core allocation. Drawdown funds can act as satellites, complementing the core with customized exposures to desired sectors, geographies, themes, and opportunities, and greater potential for alpha generation. Such an approach is predicated on a certain program size in order to meet investment minimums across the underlying funds.
Another potential approach is to select one asset class to implement with drawdown vehicles and another with evergreens. Comparing the results of the analysis above across different asset classes can help determine the relative efficiency of different fund structures. For instance, the same analysis in private credit yields a breakeven point of ~16 drawdown tranches. This suggests that the investor may find it more efficient to do drawdown funds in private equity, where they would achieve a higher performance differential and return on effort, and evergreen funds in private credit.
Additional Considerations, And Implications For Manager Selection
This study considered just one aspect of performance differential—the impact of different fund structures. As such, it assumed the same underlying private assets in both the drawdown and evergreen portfolios. However, portfolio composition will vary across funds, and portfolio management should be considered as well.
For the drawdown fund GP, knowing at the outset the total amount of investable assets makes it easier to set position and factor diversification parameters at the beginning of the investment period. Finite, multi-year investment and harvest periods provide the flexibility and discipline for a strategic approach to capital deployment and realizations.
The portfolio management process is more challenging in the evergreen structure, because capital flows are not fully in the GP’s control. GPs must contend with subscriptions and redemptions in a market in which new opportunities may not be consistently available, transactions are not instantaneous, and the market environment is not always equally attractive. Mismatches between cash flows and market attractiveness are to be expected, given end-investors’ poor track record of market timing. Yet, with the liquidity sleeve generating lower returns than private positions, evergreen managers can feel pressure to deploy inflows rapidly. For the GP, managing both the private portfolio and the liquidity sleeve become a critical part of overall return generation in this fund structure. This is one area where GPs can differentiate themselves, and should be an important focus of the manager diligence process.
1 Goldman Sachs Asset Management, from US Securities and Exchange Commission, European Securities and Markets Authority, Commission de Surveillance du Secteur Financier. As of Q1 2024.
2 Preqin. As of June 2024.
3 Goldman Sachs Asset Management, sourced primarily from SEC filings and Stanger. Includes all US domiciled evergreen funds. “At scale” is defined as $100+ million of assets.
4 Goldman Sachs 2023 Private Markets Diagnostic Survey, as of August 2023.
5 Goldman Sachs Asset Management. For illustrative purposes only. These assumptions are for illustrative purposes only and are not actual results. If any assumptions used do not prove to be true, results may vary substantially. Drawdown fund returns modeled as the approximate historical returns for drawdown funds over the past 10 years. Cash sleeve return in evergreen fund based on the Federal Reserve’s long-run policy rate; public credit returns modeled as private returns, less long-term historical yield difference between private and syndicated loans.
