Active Matters For Munis: The Added Advantages of Active ETFs

Key Takeaways
Municipal bond (muni) ETFs are mirroring the broader fixed-income market trend of increased ETF adoption. Muni ETFs have grown to $144 billion in assets under management (AUM). Recent market volatility and rising interest rates have accelerated this growth. Nearly 40% of year-to-date open-ended muni fund flows have been directed into ETFs, prompting the launch of new investment strategies. Last year 45% of muni ETF flows favored actively managed ETFs, a trend that has persisted this year as actively managed strategies continue to garner more interest. In our view, active investing and fixed income are a natural fit, and this also applies to the Muni market, which is complex and contains over 1 million separate CUSIPs from over 50,000 issuers. In this article, we highlight why an active ETF wrapper can provide potential benefits to Muni investors, ultimately capturing enhanced returns within a risk-managed framework.
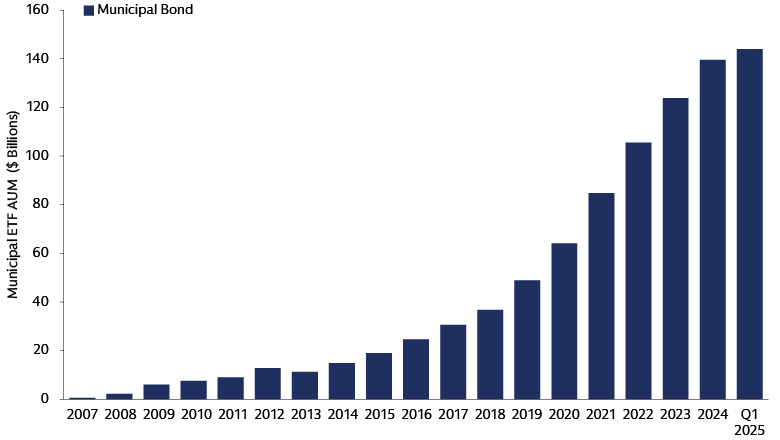
Source: Morningstar. As of May 31, 2025.
Why Active Matters For Munis
Yield curve positioning
Over the last few years, the shape and slope of the yield curve has shifted against the backdrop of higher inflation and an aggressive response by the Federal Reserve (Fed). Considering the backdrop, an active approach can deliver more attractive results to clients. For example, active managers can consider various strategies to manage duration but also the dynamics of the yield curve which include—a bullet maturity distribution, a barbell maturity structure, or a laddered approach. Depending on the environment, each has different risk reward profiles.
- Bulleted maturity strategies target specific yield curve opportunities but carry higher risk due to concentration.
- Barbell strategies balance risk and reward by allocating across short- and long-term bonds; adding intermediate bonds creates a modified barbell for potential price appreciation as the yield curve normalizes.
- Laddered strategies offer a conservative, diversified approach with consistent income.
Given today's steeper yield curve and likely Fed easing, we believe a barbell or modified barbell structure may be of interest. Flexibility and active management remain crucial for adapting to evolving market conditions.
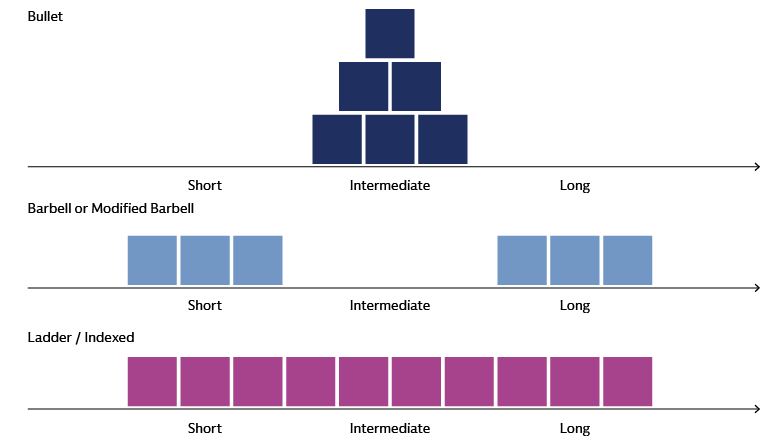
Source: Goldman Sachs Asset Management. For illustrative purposes only.
High yield munis: Income, diversification and tax advantages?
In the municipal bond market, income is a key driver of returns. To help increase return potential, municipal credit offers an attractive risk / reward trade-off, especially for investors in higher tax brackets. In addition to the inherent tax advantages, high yield municipal bonds can also enhance portfolio diversification given idiosyncratic risk profiles and lower correlation with equities. High-yield munis have also exhibited lower historical default rates than their high yield corporate counterparts—a powerful differentiator for the asset class. Strong balance sheets and conservative financial management of budgets, among other strong credit fundamentals, support the asset class and help drive the relatively low historical default rate.
Today the municipal high yield index yields 5.85%, or 9.88% on a tax-equivalent basis;1 a 2.45% advantage on a taxable equivalent basis over comparable high yield corporate bonds. Additionally, over time, the returns have been compelling within the municipal asset class. Over the last 10 years, municipal high yield has returned 4.42% versus 2.16% for the broader municipal index.
While we believe an allocation to high yield municipals may boost returns, working with an investment manager with a tenured credit research team to sift through the opportunity set is key. Credit opportunities can be fleeting, therefore an active approach to security selection and determining the right environments to dial up and down credit risk within portfolios is essential. A static and passive approach that is followed by index-based strategies may not be an optimal way of capitalizing on this unique and idiosyncratic market.
Source: Goldman Sachs Asset Management. Bloomberg Municipal Aggregate Index as of May 31, 2025. For illustrative purposes only.
Active advantages over passive?
Canvassing the entire municipal market, across both the interest rate and credit spectrum, is a powerful starting point for investors. This broad view helps active investors identify the best risk / reward opportunities across the market and deliver attractive returns to clients.
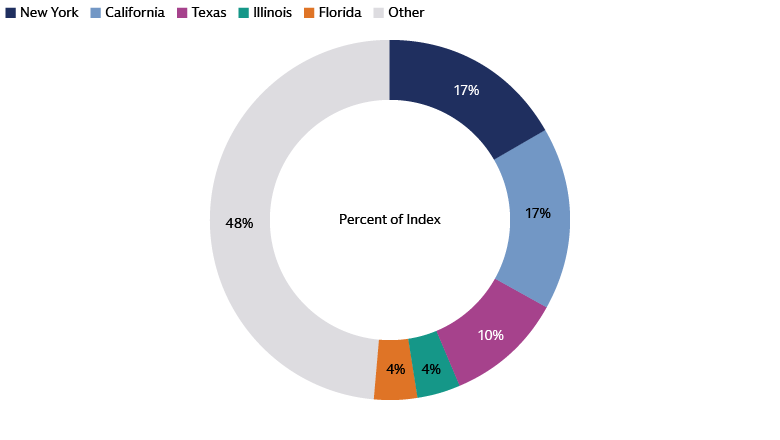
While we think carefully about the opportunity set of the market as a whole; we don’t think owning the entire index is a recipe for a long term favorable outcome. As is the case for investors in many asset classes, there are shortcomings of purely indexing in the municipal market. As an example, the Bloomberg Municipal Aggregate Index is dominated by five states which represent roughly half of the index. If you look at the returns of each of these five states (New York, California, Texas, Florida and Illinois) over the last 5-years, only one—Illinois— has outperformed the national market. In addition, persistently strong in-state demand for bonds in high tax states like New York and California, lead to overall index yields that may be less attractive to a national investor given the large concentration of these states in the index.
We believe active managers can demonstrate an edge over passive strategies, potentially offering more attractive income through thoughtful portfolio construction that integrates active security selection, duration management, and credit exposure.
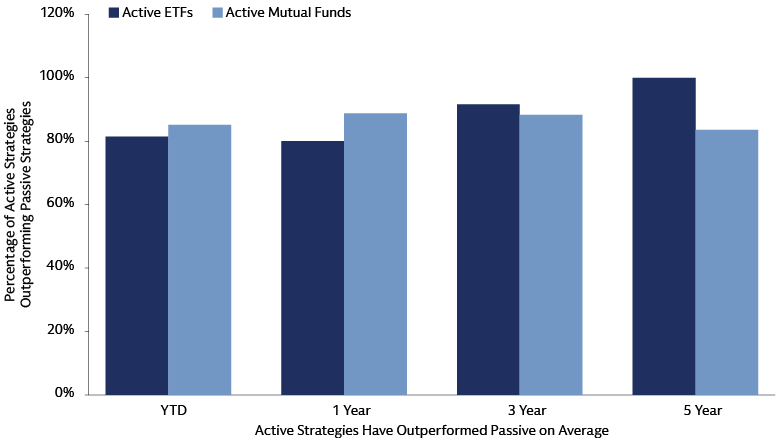
Source: Morningstar, Goldman Sachs Asset Management. As of May 31, 2025.
The Future for Muni ETFs Is Active
Active municipal bond strategies ultimately offer greater potential value to investors compared to passive municipal ETFs. Active management allows for a more discerning approach that goes beyond simple benchmark indexing and high credit quality focus. To deliver a long-standing positive result to clients, we think an active approach is the best way to unlock opportunities within the complex municipal bond market.
1 Tax-Equivalent Yield shown for municipal yields which reflect the top tax bracket of 37% in addition to the Medicare surcharge tax of 3.8%.
