From Defense to Offense: Finding the True Value of Tail-Risk Hedging

Tail-Risk Hedging: A Tool to Boost Long-Term Performance Potential
Tail-risk hedging strategies are in focus for many investors, driven by elevated equity valuations fueled by AI enthusiasm, an uncertain policy environment, and increased market volatility. While the term "tail-risk hedging" lacks a universally agreed-upon definition, a primary objective is typically to generate positive, and ideally convex, returns during equity drawdowns, while also aiming for slightly positive returns in more stable market conditions. Investors use a range of strategies in this space, including equity put-buying and VIX strategies (e.g., buying VIX calls, holding VIX futures), trend-following, and more indirect approaches in rates and FX markets.
These strategies are designed to have zero equity beta across the market cycle,1 meaning that, over a complete cycle of rising and falling markets, their overall movement is not correlated with the broader stock market. To achieve this result, they are often structured to behave differently in various market conditions:
- During periods when the stock market is experiencing significant downturns, tail-risk hedging strategies are expected to exhibit a highly negative beta. A negative beta indicates that an asset tends to move in the opposite direction to the market.
- Conversely, during more frequent periods when the stock market is generally rising, these strategies are expected to have a low but positive beta. A positive beta means the asset generally moves in the same direction as the market. Low beta suggests it might participate modestly in market gains but would not be expected to keep pace with the broader market's upward movement.
These unusual characteristics pose challenges for traditional portfolio construction. Some of the most challenging questions include how to benchmark these strategies, how to defend allocations to them during periods of strong market performance, and how to size them relative to other portfolio exposures. Consequently, we believe it is crucial to establish a robust framework for evaluating, allocating to, and assessing their success.
In this article, we propose a framework for how to use tail-risk hedging strategies in multi-asset portfolios. The bottom line: we believe tail-risk hedging strategies should not be judged as standalone return generators; adding risk mitigation to an equity portfolio adds minimal value. In our view, the true value-add is that risk mitigation permits more risk taking. By reducing the magnitude of losses in bear markets, risk mitigation allows investors to boost the level of risk across the cycle and retain the upside from core risk assets like equities.
Why Standalone Tail-Risk Hedging Falls Short
We believe a standalone tail-risk hedging strategy offers minimal return benefits to portfolios. To demonstrate this, we generate a hypothetical performance record of a hedging strategy that offers protection during drawdowns but does not have correlation to the market across the cycle and has expected returns of zero.2 We generate a hypothetical performance record rather than using the representative returns of a specific strategy (e.g., equity-hedged put-buying) to illustrate a more general point about tail-risk hedging, but any specific strategy can be compared against this framework.
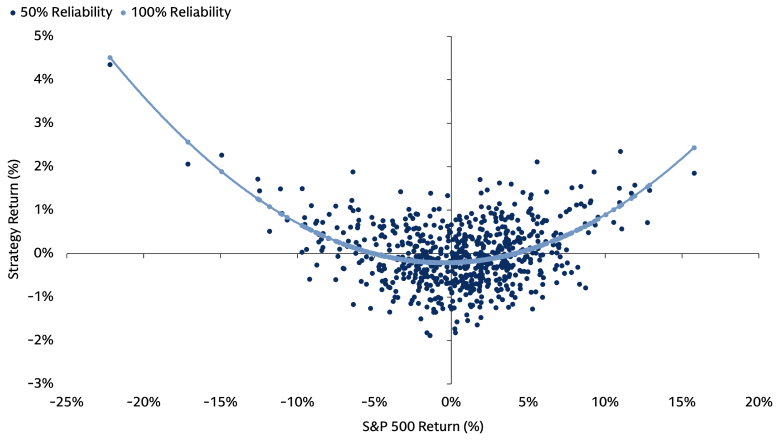
More formally, this model for a tail-risk hedging strategy gives exposure to the squared return of the market but has no beta or correlation to the market:

Rather than focusing on ε, we introduce a more intuitive metric: “reliability.” We define reliability as the degree to which a tail-risk hedging strategy’s returns correlate with an ideal, effective hedging strategy. This correlation directly influences the value of ε. For context, an ideal strategy would have 100% reliability (ε = 0), while a publicly available proxy like the CBOE PPUT strategy typically exhibits about 40% reliability based on this metric,3 and as illustrated below, we compare a perfectly-reliable strategy to one with reliability of 50%. In our own portfolios, we blend a range of different tail-risk hedging strategies, and reliability tends to range from 20% to 70%.
Our analysis, using this framework, shows that even when optimally integrating highly reliable hedging strategies into an equity portfolio, the impact on returns is negligible. Even an idealized 99% reliable strategy provides an annual return boost of only 0.8 basis points.4 Notably, a zero-alpha strategy does add value, by trimming the left tails, it boosts the rate of compounding over time, but in our view, such a minimal increase does not justify implementing tail-risk hedging as a standalone approach.5
Source: Goldman Sachs Asset Management. As of November 30, 2025.

Source: Goldman Sachs Asset Management. As of November 30, 2025.
Not Simply a Shield, But a Springboard for Potential Returns
Downside Risk Mitigation with Upside Potential: Even though protecting against extreme market downturns does not significantly increase profits by itself, tail-risk hedging becomes helpful for boosting returns when the entire investment portfolio is adjusted to include these protections. Since tail-risk hedges have the potential to reduce negative impacts from severe market drops, they also allow a portfolio to take on more of its main market risks, such as investing more in stocks (equity beta).
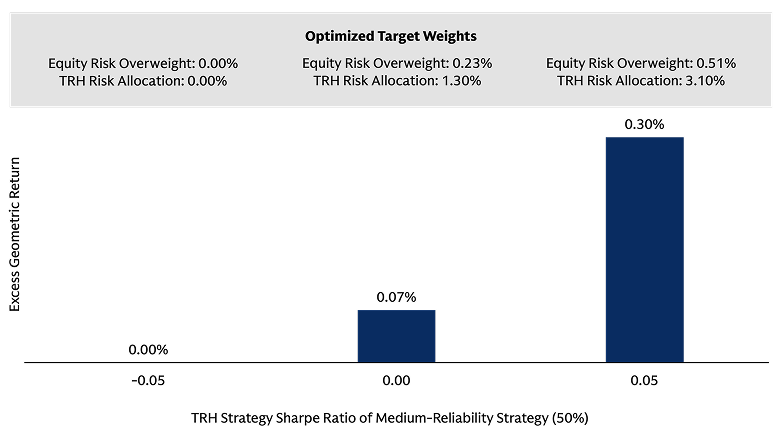
Quantifying the Potential Benefits: To illustrate the impact that different tail-risk hedging strategies could have, using the same simulated model as before, we vary how reliable the hedging strategy was and how much extra return (alpha) it generated using values that align well with what we tend to observe in real-life strategies. We then combine each strategy with additional equity risk, sized according to the level of market risk that the hedging strategy helped to reduce during downturns. Crucially, while hedging does not show much financial benefit in the analysis above, when the portfolio uses the capacity that tail-risk hedges permit to take additional market risk, results improve markedly.
Enhanced Long-term Returns and Alpha Potential: Based on that analysis, a hedging strategy that is 50% reliable and generates zero alpha on its own should allow for about 1.5% more investment in stocks (i.e., a 23 bps risk attribution to equities). Further, the ideal amount to allocate to this type of protection against extreme market events is about 1.3% of the portfolio's risk on its own. That combination drives an incremental 7 bps of compounded returns over time, which is an order of magnitude greater than the impact of adding hedges without additional equity risk. Further, if hedges can generate even very modest alpha on their own (which many strategies do over the long run), the impact on the portfolio increases substantially, rising to a +30 bps impact to the rate of compounding with even a 0.05 Sharpe ratio. This benefit grows with more reliable protections and higher extra returns.
Source: Goldman Sachs Asset Management. As of November 30, 2025.
From Top to Tail: Gaining a Comprehensive Understanding
Ultimately, we believe tail-risk hedges can play an instrumental role in enhancing overall portfolio returns, particularly for institutional investors. While equity investments are the primary drivers of returns, hedges make it strategically viable to maintain a higher allocation to equity risk. In essence, greater gains are realized by boosting a portfolio's upside beta, a strategic move that tail-risk hedges effectively enable. In our view, utilizing a framework with a clear methodology is key when assessing the appropriate size of a tail-risk hedge and equity overweight. Specifically, we believe the sizing must be determined by its reliability and its expected Sharpe ratio. Should a hedging strategy exhibit sufficiently low reliability or a negative Sharpe ratio, its attractiveness diminishes. Conversely, we find strategies that are both reliable and generate alpha can substantially elevate portfolio-level returns through optimized portfolio construction.
1 While some tail-risk hedging strategies have non-zero beta across the cycle, we note that if one seeks to change portfolio beta, simpler approaches likely apply.
2 We use a hypothetical example here to show the idealized form of tail hedging. Each concrete and implementable strategy under consideration can then be compared to the idealized form as part of strategy and manager selection.
3 PPUT here refers to the Cboe “S&P 500 5% Put Protection Index”, which measures the performance of a passive investment strategy that involves systematically buying S&P 500 Index (SPX) put options to hedge an equity position.
4 To size the tail-risk hedging strategy addition to the all-equity starting portfolio, we make an assumption about an investor’s risk aversion. By revealed preferences, in that an investor was comfortable holding all equities, that positioning reflects their risk aversion. Based on the historical return and risk of equities, we then can calibrate a function to compare different portfolios under that investor’s utility function, which is how we select the utility-maximizing one. The specific form of utility function we fit is CRRA (Constant Relative Risk Aversion), which is consistent with much of the foundational academic finance literature.
5 To expand on the compounding argument, some commentators anticipate substantial benefits for limiting left-tail risks and thereby reducing risk of ruin. In the limit case, a -100% return definitionally ends future compounding, and reducing the frequency and magnitude of drawdowns should boost geometric returns, which we see here. Our observation is that, with equity returns, the impact of blunting tails is small, though it would likely be a larger relative contribution to the returns of a strategy with heavier left tails than equities have.
