Investing Beyond the US: The Equity Market Opportunity



1. Why look beyond the US for diversification?
Markets in Europe, Australasia, and the Far East (EAFE) can provide greater diversification relative to the S&P 500, with less concentration among the top ten holdings and more exposure to different parts of the economy, including financials and industrials. This underscores the broader and more balanced opportunity set available outside the US.
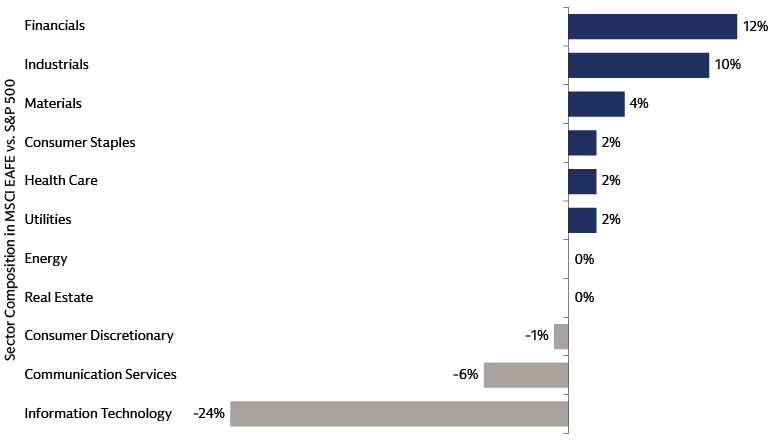
Source: MSCI and FactSet. As of March 31, 2026. Diversification does not protect an investor from market risk and does not ensure a profit. The portfolio risk management process includes an effort to monitor and manage risk, but does not imply low risk.
2. What growth opportunities exist outside the US?
Europe is gradually deploying its fiscal firepower across infrastructure and defense, which may boost growth. In Japan, earnings are expected to accelerate, supported by improving shareholder returns aided by corporate governance reforms.
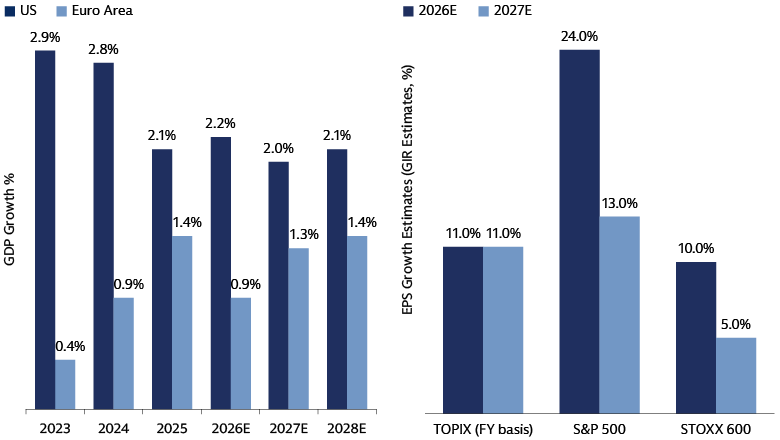
Source: (1) Goldman Sachs Global Investment Research. As of June 8, 2026. (2) Bloomberg. As of March 31, 2026. The economic and market forecasts presented herein are for informational purposes as of the date of this presentation. There can be no assurance that the forecasts will be achieved. Please see additional disclosures at the end of this presentation.
3. Where can market inefficiencies create alpha?
International markets are under-researched and fragmented. Japan is one of the largest under-researched equity markets globally, and most information is in the local language. In Europe, information about stocks diffuses more slowly than in the US, creating opportunities for active stock selection.
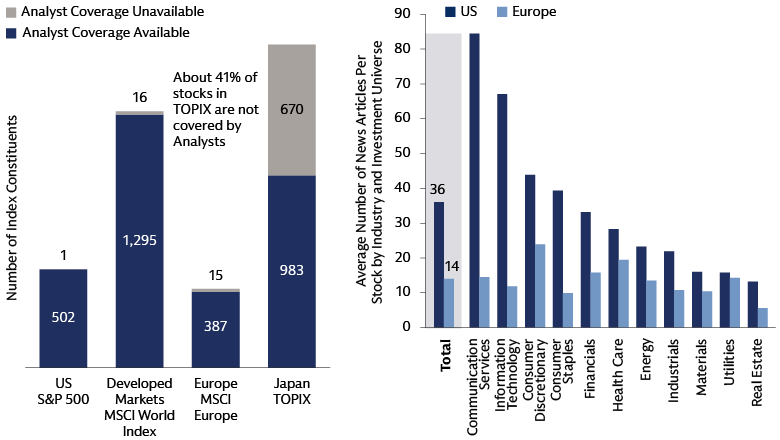
Source: (1) Goldman Sachs Asset Management, Bloomberg. Proportion of availability of any analyst coverage per stock in the respective benchmark universe. For illustrative purposes only. Index constituents' data are as of March 31, 2026. Analyst coverage data are as of April 16, 2026. The Japan TOPIX Index Value and the Japan TOPIX Marks is subject to the proprietary rights owned by JPX Market Innovation & Research, Inc., or affiliates of JPX Market Innovation & Research, Inc. (hereinafter collectively referred to as "JPX") and JPX owns all rights and know-how relating to Japan TOPIX such as calculation, publication and use of the Japan TOPIX Index Value and relating to the Japan TOPIX Marks. JPX shall not be liable for the miscalculation, incorrect publication, delayed or interrupted publication of the Japan TOPIX Index Value. (2) Goldman Sachs Asset Management, Dow Jones. As of December 31, 2024.
4. Are international equities more attractively valued?
A valuation gap persists as non-US equities continue to trade at a discount to US stocks. Specifically, the MSCI EAFE Index is priced at a historically wide discount to the S&P 500, which we believe creates a potential entry point for investors seeking undervalued opportunities.
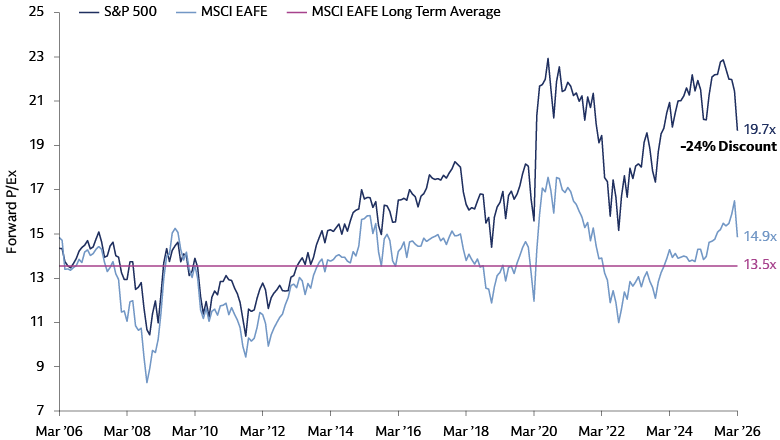
Source: MSCI, FactSet. As of March 31, 2026.
5. How can income strengthen total returns?
International equities are structurally higher yielding, making dividends a meaningful driver of total returns. While dividends enhance total return potential during market upswings, they also serve as a defensive anchor, seeking to provide risk protection and capital preservation amid market volatility.
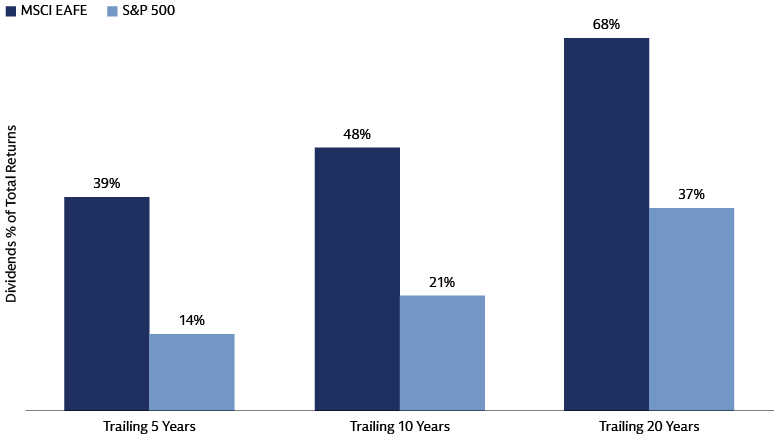
Source: FactSet. As of December 31, 2025.
We believe capturing alpha in global markets requires a global network and deep data expertise; our team is ready to navigate these global opportunities alongside you.