Seeking Alpha in Inefficient Markets: The Case for Quant



Key Takeaways
Equity markets are increasingly complex and driven by passive and retail investors whose investment decisions are not based on the fundamental metrics that professional investors have traditionally used to assess the fair value of stocks. Their activity, which accounts for an ever-larger share of total equity trading, creates price dislocations that have made markets more complex and less efficient.
Investors who fail to account for these structural changes in equity markets are operating at a significant disadvantage, in our view. By contrast, active managers with an investment process designed to take advantage of the dislocations created by price-indifferent market participants can potentially generate a sustainable edge.
To succeed, active investors must be able to decode complex flow dynamics and distinguish between informed institutional capital and uninformed passive and retail flows to position portfolios on the right side of market dislocations. By stepping in as liquidity providers when non-fundamental forces distort prices, agile data-driven managers can potentially capture significant, uncorrelated excess returns while managing downside risks.
The Increasing Complexity of Equity Markets
Of the main factors driving the evolution of equity market structure, passive index-tracking strategies may be the most recognizable. They have surged in popularity thanks to their lower costs, scalability, and operational simplicity. From 2015 through 2025, for example, cumulative flows into US passive mutual funds and ETFs reached $3.5 trillion, while slightly more ($3.6 trillion) flowed out of active equity funds.1 US passive vehicles surpassed active funds by total assets in 2024, and the gap continues to widen.2
Passive funds track their underlying indices. When they are periodically forced to adjust their holdings in line with the reconstitution of these indices, the resultant investment flows are therefore highly predictable. On index reconstitution days, crowded buying pressure can drive stock prices above their long-term averages, though they tend to revert over time. When this trading occurs in large volumes, it also drives increased risks. This pressure can become so intense that trading costs for price-agnostic investors can run three times higher than those paid by institutional investors in similar-sized trades.3
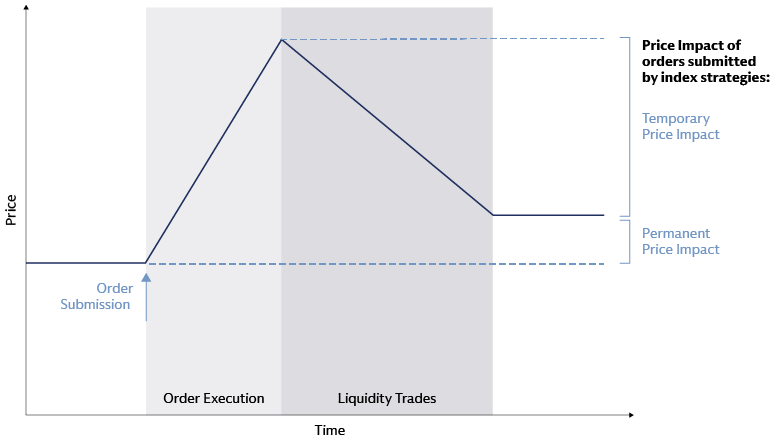
Source: Goldman Sachs Asset Management. For illustrative purposes only.
The rise of retail investors has introduced another layer of dislocation. We believe retail investors, who now account for a fifth of total US trade volume,4 tend to make predictable buying and selling decisions based on spurious signals, emotions, and fads, rather than fundamental analysis, while exhibiting frequent herding behavior. The chart below shows typical characteristics of stocks favored by retail investors. On average, stocks with the highest retail participation tend to have lower share prices, smaller market capitalizations, higher volatility, poorer profit margins, weaker returns on assets, and significantly higher short interest.
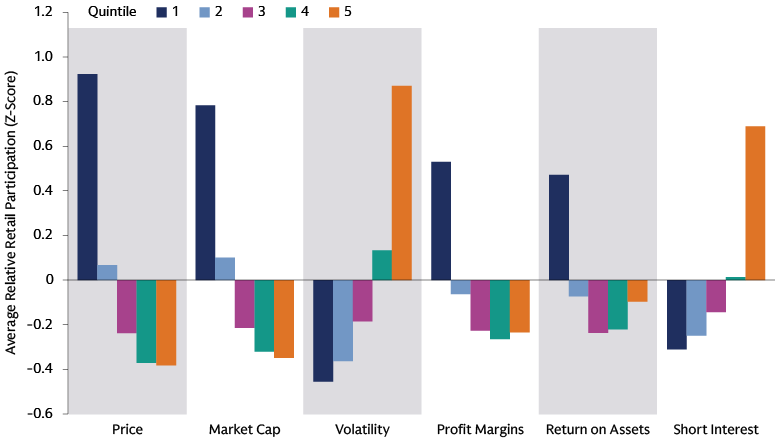
Source: Goldman Sachs Asset Management. Data from January 2020 to July 2025 based on stocks in the QIS US equity total market universe. We calculate a daily retail participation z-score (the number of standard deviations by which the stock's retail flow exceeds the cross-sectional mean among all other stocks on that date) for every stock per date. For each of the 6 key metrics outlined (price, market capitalization, volatility, profit margins, return on assets, and short interest) we split all stocks into equal-sized quintiles. Ultimately, for each quintile per metric, the chart plots the average retail participation z-score across dates. For illustrative purposes only.
This investment behavior can push stock prices meaningfully away from their intrinsic value in the short term. The rise of retail trading platforms and commission-free trading has amplified the potential impact of these dislocations, which create opportunities for informed active investors to profit. This can be seen in the long returns of actively managed mutual and hedge funds from investments in stocks with high retail participation. Since 2020, these bets have significantly outperformed the funds' bets on stocks with less interest from retail investors.5
Values-based investing, global ownership and mega investors
Beyond passive and retail flows, a broader set of structural forces, including the rise of values-based mandates, the divergence of global and domestic stock ownership, and institutional constraints, compounds the near-term disconnect between prices and fundamentals.
Values-based mandates from institutional investors can contribute to this shift because they often rely on simplistic economic rationales, resulting in structural tilts that can create repeated and predictable distance between stock prices and intrinsic values. The market impact of these tilts and exclusions was limited when the number of investors adopting sustainability considerations was small, but this cohort has grown significantly in recent years, increasing its potential impact.6
The prominence of hedging strategies can also worsen price dislocations as concentrated derivative trades can often force trades in underlying assets that are driven by mechanisms such as delta hedging loops, margin calls, and liquidation, rather than by fundamental factors.
As global equity ownership increases, the higher complexity of investor bases can often bring fragmentation. In some markets, such as Japan, a clear bifurcation emerges between investors who understand the local language and local market idiosyncrasies and have deep access to relevant information, and those who do not. Disconnections in flow directionality between different investors in such markets point to the divergence of investment views that heighten inefficiencies.
Mega-sized investment vehicles further exacerbate inefficiencies. Many large mutual funds are governed by strict compliance frameworks and diversification rules that prevent them from acting fully on their convictions. There are also liquidity and size constraints. For example, a $10 billion fund cannot buy a small-cap stock without moving the price dramatically, effectively locking it out of thousands of smaller companies. All these factors limit the ability of managers to express their convictions and hinder efficient price discovery.
Impact on price discovery
As a result of these changes in equity market structure, asset prices have become increasingly reactive to short-term dynamics as compared with long-term fundamentals. This can be seen in the decline in the explanatory power (R²) of fundamental metrics from quarterly reported earnings for near-term stock price movements.
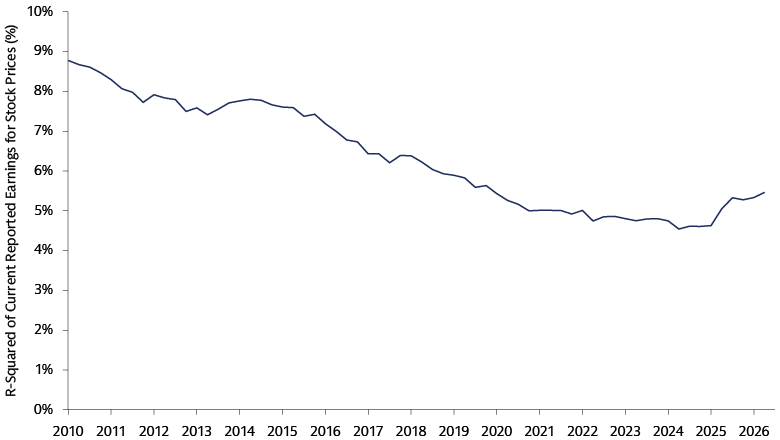
Source: Goldman Sachs Asset Management, FTSE Russell, IBES. As of June 30, 2026. The R-squared from a cross-sectional regression of two-day excess stock returns versus earnings surprise. The two-day window includes the day prior to and the day of the earnings announcement. The sample comprises the constituents of the Russell 1000 Index. Each point on the curve represents the trailing 20-quarter mean of the corresponding statistic to smooth the series. The sample period is 2010:Q1 to 2025:Q4. (64 quarterly observations). For illustrative purposes only.
The implication is that active managers must adapt. They increasingly need to supplement traditional financial data, which may be most effective on longer-term horizons, with more nuanced forward-looking indicators and a deeper understanding of the non-fundamental forces that are shaping prices over the shorter-term. This requires both “nowcasting” signals that offer an earlier read on future profitability and quality characteristics, as well as tools that look beyond company fundamentals to capture the shifting sentiment, positioning, and flow dynamics that increasingly dislocate prices from intrinsic value. In our view, the new playbook for capturing market inefficiencies is defined by the ability to complement longer-term fundamental, company-specific analysis with innovative techniques to capture shorter-term market dynamics. This requires investors to source novel data, interpret it with discipline, and apply it dynamically across changing market regimes.
Gaining an Informational Edge
While the impact of traditional financial metrics on shorter-term stock price moves is declining, the explosion of unstructured data offers investors new opportunities to gain an informational edge. Data sources including news reports, other media, earnings call transcripts and audio, patents, and web and app traffic, can provide investors with a deeper understanding of companies’ potential and market trends – if they have the tools to harness it. We see a clear gap between the potential value of these datasets and their practical integration into various investment processes, which creates an asymmetric opportunity for systematic managers capable of translating the data into differentiated insights.
Sourcing alpha from passive and retail-driven market dislocations requires a systematic framework to decode participant behavior. This involves formulating informed hypotheses regarding how different market actors affect price dynamics, recognizing that not all behavior carries the same informational content, and acting on these insights in a disciplined manner.
For example, institutional trades may be considered more informed than retail trades, and domestic investors may be assumed to have an informational edge over international allocators. Passive fund rebalancing and retail crowding, by contrast, may be viewed as fundamentally uninformed flows. By integrating these participant-level insights into a real-time view of market microstructure, skilled quantitative managers can translate them into alpha through two key pillars:
- Analyzing flow data to detect distinct trading patterns among different investor types
- Inferring sentiment from sources including buy-side positioning, sell-side analyst tone, management earnings call language, and broader market attention by using natural language processing and transformer-based models
Active positioning for passive dislocations
To exploit dislocations created by passive investment flows, systematic strategies first need to identify fund reconstitution dates. In the absence of an explicit calendar, managers can define reconstitution as dates on which a fund’s gross turnover exceeds a certain percentage of assets under management. Since reconstitution fund flows do not exhibit momentum, and this uninformed trading moves prices away from fundamental values, active managers can take positions in the opposite direction of reconstitution trades to capture the subsequent reversion.
Following the initial price moves, dislocations caused by passive flows around reconstitution persist in the market for an extended period, providing a sustained window for alpha generation. The potential profit for informed investors decreases gradually over an average period of about 50 weeks. The profit earned from the aggressive trades related to any single index may be modest, but the cumulative profits from the trades of all index strategies can be material given the large number and size of indexed portfolios.
Responding early to retail-driven moves
To profit from retail-driven dislocations, investors must first identify retail flows, a resource-intensive task that involves consolidating and analyzing vast amounts of granular daily flow data. Decoding the markers of retail activity such as sub-penny price improvements and odd-lot trades requires extremely detailed data that captures trade-, quote-, and tick-level information. Processing this information demands robust computing capacity and rigorous data validation mechanisms to ensure redundancy and reliability. Only with this infrastructure in place can systematic managers confidently infer retail participation and anticipate short-term momentum.
Like the dislocations created by passive reconstitution flows, retail-driven dislocations tend to persist. After a price shift caused by a spike in retail trading, the profit potential persists for about 25 weeks before fully reverting. Portfolio responses should be dynamic, in our view:
- Reducing large underweights to rallying benchmark names
- Moving selected positions closer to index weight
- Tightening risk around crowded shorts
- Reallocating active risk to higher-conviction alpha opportunities
- Seeking to trade the potential reversal effects
For diversified, tracking-error-constrained portfolios, avoiding a rallying low-quality name can be an inefficient use of risk budget and may create unintended risk exposures that could contribute to underperformance. During retail-driven rallies disconnected from business fundamentals, benchmark-level exposure may be the neutral position. This does not imply a positive long-term fundamental view; it reflects disciplined risk management while preserving capacity to express alpha convictions elsewhere.
On the other side of dislocations generated by retail trading, tracking institutional flows and hedge fund sentiment allows systematic portfolio managers to align their portfolios with sophisticated market participants who leverage deep research capabilities. A primary metric for this analysis is short-interest data, specifically focusing on dynamic changes in short-selling activity and broader buy-side positioning over time. By monitoring how professional investors adjust their capital allocation and short exposures, skilled quantitative managers can detect shifts in professional conviction and market expectations before they become widely recognized by the broader market.
Capitalizing on shifting perceptions
In a market increasingly dominated by price-indifferent flows, sentiment signals help systematic managers distinguish between dislocations that are likely to persist and those that may revert quickly. For this purpose, advanced systematic strategies may need to leverage natural language processing to extract investor attention and sentiment signals from unstructured data.
The liquidity footprints of investor types differ significantly, however, so we believe it is crucial to apply these techniques with a nuanced understanding of how sentiment from different participants impacts the market. For example, the effectiveness of news sentiment analysis varies significantly based on the level of retail participation in a stock. Where this participation is low, the directional sentiment conveyed in the news has a clear, predictable impact on subsequent price movements, aligning with the informed behavior of institutional investors. Where retail participation is high, these directional signals often break down because these investors do not typically trade in the direction that news sentiment suggests.
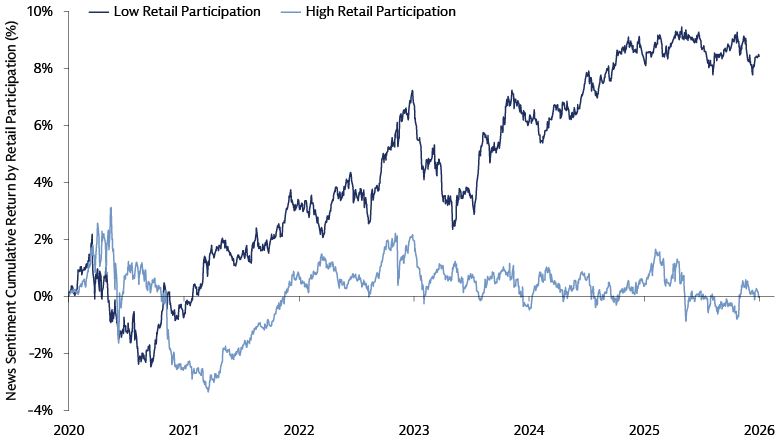
Source: Goldman Sachs Asset Management. Data from January 2020 to December 2025, encompassing the QIS US Total Market equity universe. Depicts the cumulative returns of a sentiment factor based on overweighting stocks with a positive news sentiment and underweighting stocks with a negative news sentiment, considering Dow Jones News data, segmented by high and low retail participation, defined as top and bottom quartiles of retail flow. For illustrative purposes only.
For highly retail-concentrated stocks, the degree of attention itself often matters more than the sentiment direction. In these cases, negative news can trigger short-term buying pressure simply because a stock's visibility rises, although this effect typically reverses quickly. Skilled active managers can capitalize on this attention-effect reversal by inferring retail attention through media channels primarily consumed by retail investors, such as television news, web searches, and online or print media outlets, and positioning themselves on the opposite side of the trade once the initial, attention-driven price spike begins to fade.
Mining market infrastructure
The increasing fragmentation of investor types across global equity markets introduces a further layer of exploitable dislocations that differ across markets. Such dislocations have been particularly evident recently in South Korea, for example. Korean domestic institutional investors tend to be well-informed, and their trading patterns are aligned with subsequent index moves. Foreign investors, many acting as asset allocators or facing language and information barriers that limit their edge in local markets, show considerable negative flow correlations with broader market returns. Domestic retail investors account for a substantial share of trading activity, and their flow patterns are strongly contrarian (negatively correlated with intraday stock returns) but positively correlated with ultimate daily index moves. The result is a marketplace where different participant groups frequently take opposing sides of the same trade, driven by fundamentally different motivations, time horizons, and information sets. As a clear illustration of this fragmentation, this year saw record dislocations between foreign capital outflows and domestic capital inflows into South Korean equities.
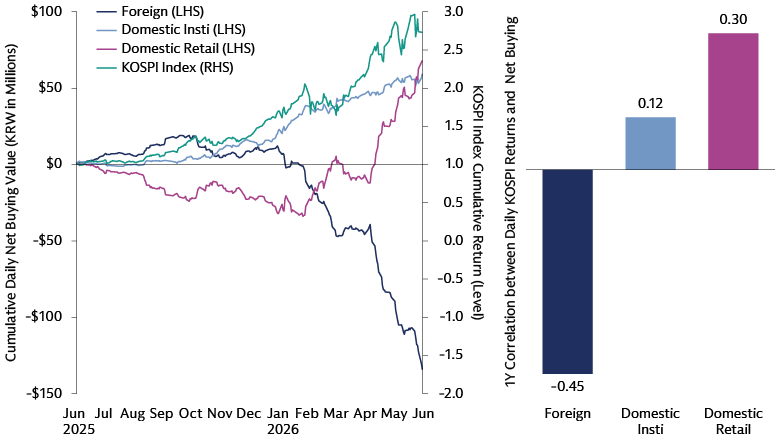
Source: Goldman Sachs Asset Management, Bloomberg. As of June 30, 2026. Net buying estimates are produced by Bloomberg Intelligence, encompassing total volume traded across exchanges (KOSPI and KOSDAQ) and other trading venues by each investor type. KOSPI Index return shown is the cumulative level indexed at 1 = 20/06/2025. Correlation shown is the 1Y correlation between daily KOSPI returns and daily net buying per investor type. For illustrative purposes only.
Skilled quant managers can monitor these flow imbalances almost in real time, constructing signals that distinguish between informed and uninformed flows and identifying periods when the divergence between participant groups is most acute. By systematically tracking the directionality and magnitude of net buying and selling across foreign, domestic institutional, and domestic retail investors, these managers can detect when uninformed or mechanistic flows have pushed prices away from fundamentals and position portfolios to capture the subsequent correction. It is this granular, participant-level understanding of market microstructure, combined with the computational power to process and act on vast quantities of flow data, that enables the most effective systematic investors to extract alpha from the very structural forces that many market participants take for granted.
Data-Driven Alpha Generation
The structural evolution of global equity markets has changed the ways alpha is generated. As passive indexing, retail sentiment, values-based mandates and increasing fragmentation decouple near-term stock prices from corporate fundamentals, traditional static investment approaches are no longer sufficient. In this disrupted landscape, an active, adaptive approach is essential.
In particular, skilled systematic managers with the ability to harness unstructured, forward-looking data while retaining experience-based economic grounding, can offer a multi-horizon framework to seek an informational edge, capitalize on these dislocations, and manage the risks they create. Crucially, this modern playbook does not abandon traditional investing. Instead, it complements longer-term fundamental analysis with dynamic, short-term insights, such as from nowcasting profitability and tracking flow dynamics, to build a more resilient, comprehensive view of the market.
Ultimately, we believe the future of asset management belongs to investors who can successfully bridge these horizons. By combining an active investment philosophy with portfolio agility and technological innovation, forward-thinking systematic managers can effectively navigate short-term risks and opportunities, exploit temporary price dislocations, and turn structural market inefficiencies into a source of consistent, long-term alpha.
1 Goldman Sachs Global Investment Research. As of December 2025.
2 “Active vs. Passive Fund Performance: When Do Active Managers Win?” Morningstar. As of April 1, 2026.
3 Sida Li, “Should Passive Investors Actively Manage Their Trades?” SSRN. As of November 18, 2021.
4 Goldman Sachs Asset Management, Bloomberg. As of December 2025.
5 Goldman Sachs Asset Management. As of December 31, 2025.
6 This is especially true for companies in sectors that are most directly affected by sustainability considerations, such as climate change. The organization Stand.earth maintains a list of global institutions that have made a commitment to divest fully or partially from fossil fuels. As of mid-June 2026, the list consisted of 1,731 institutions overseeing nearly $41 trillion in assets. See the “Global Fossil Fuel Divestment Commitments Database,” Stand.earth. As of June 10, 2026.