Corporate Pension Monthly


Falling Leaves, Falling Liabilities
In September, our estimate of the aggregate corporate defined benefit (DB) funded status increased to 114.2%, up from 112.2% in August. Financial markets were shaped by a more hawkish central bank backdrop, with long-term interest rates rising to multi-year highs as investors reassessed the path of monetary policy. Higher discount rates reduced the present value of pension liabilities, providing a meaningful tailwind to funded status. With liabilities falling materially and assets lower, the decline in liabilities was the primary driver of the improvement in our estimated funded status over the month.
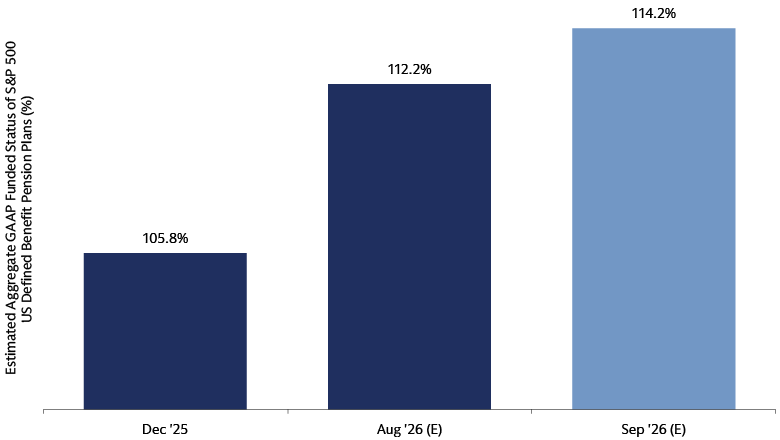
Chart source: MSCI, Bloomberg, and Goldman Sachs Asset Management as of September 2026. Generally Accepted Accounting Principles (GAAP) funded status based on US plans (when specified) of S&P 500 companies (i.e., 229 companies with pension data per GS Asset Management research). Past performance does not predict future returns and does not guarantee future results, which may vary. The funded status figures are estimated and unaudited as of September 30, 2026, and subject to potentially significant revisions over time. Actual returns may vary significantly. The economic and market forecasts presented herein have been generated by Goldman Sachs Asset Management for informational purposes as of the date of this presentation. They are based on proprietary models and there can be no assurance that the forecasts will be achieved. Please see additional disclosures at the end of this presentation.
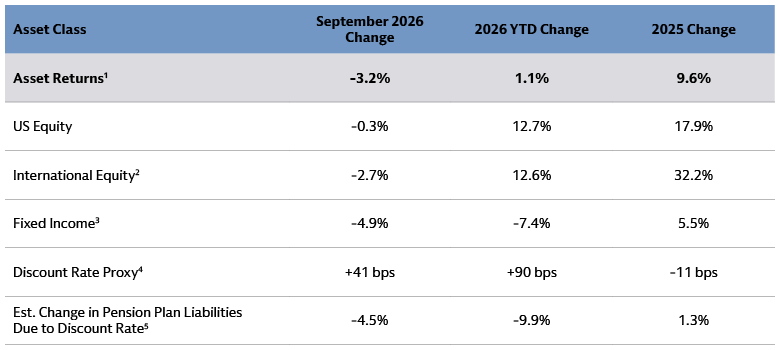
Source: MSCI, Bloomberg, and Goldman Sachs Asset Management. As of September 30, 2026. Past performance does not predict future returns and does not guarantee future results, which may vary.
Recent Matters of Note
September highlighted both the evolving legal landscape and sustained sponsor interest in pension risk transfers (PRT):
- Legal update: The first appellate review of the recent wave of PRT litigation took place in September for a case originally filed against Lockheed Martin and its independent fiduciary in March 2024. The outcome may provide additional guidance regarding fiduciary considerations in insurer selection and transaction diligence. We believe that while PRT activity remains active, the outcome could influence future market practices regarding the documentation of annuity provider selection in future de-risking transactions.
- PRT market momentum: According to LIMRA, PRT activity remains healthy, but sponsors are increasingly favoring smaller, more targeted transactions over large-scale buyouts. While Q2 2026 PRT dollar volume declined and no individual deals exceeded $250 million, the number of transactions increased, reflecting continued sponsor interest amid strong funded status levels and less urgency to fully offload pension liabilities.
For more insights specific to corporate pension plans, we recently explored why we believe higher yields and historically strong funded positions may offer a compelling opportunity for plans to revisit their de-risking strategies. Our team is ready to explore these topics with you.
1 Asset return: Average asset-weighted return of S&P 500 companies’ US plans (when specified). US Equity uses S&P 500 Index.
2 Mix of MSCI EAFE and MSCI ACWI ex-US.
3 Mix of Corporates (Bloomberg US Aggregate Bond), High Yield (Bloomberg US High Yield), Treasuries (Bloomberg 20+ Year Treasuries), and Long Credit (Bloomberg Long US Credit).
4 Discount rate proxy measured by 50% Moody’s AA Corporate Bond and 50% US Long Duration Corporate Bond.
5 Estimated Change in Plan Liabilities based on increase in estimated discount rate and duration of 12. For 2025, uses average change in discount rate change for December year-end filers.