Corporate Pension Quarterly: Cultivating Confidence with Corporate Credit
Quarterly Snapshot
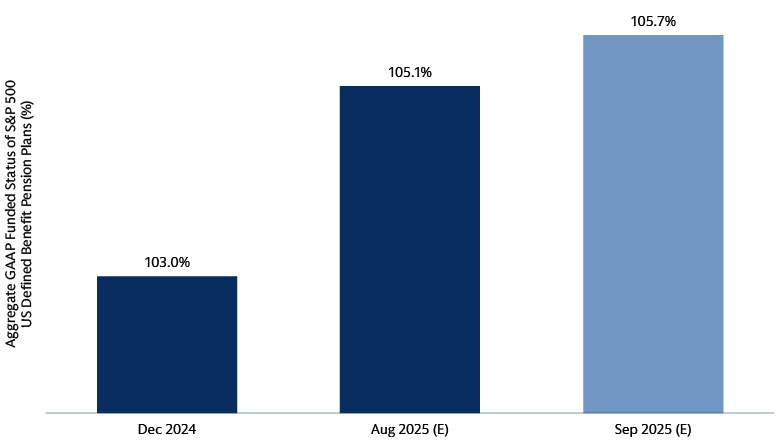
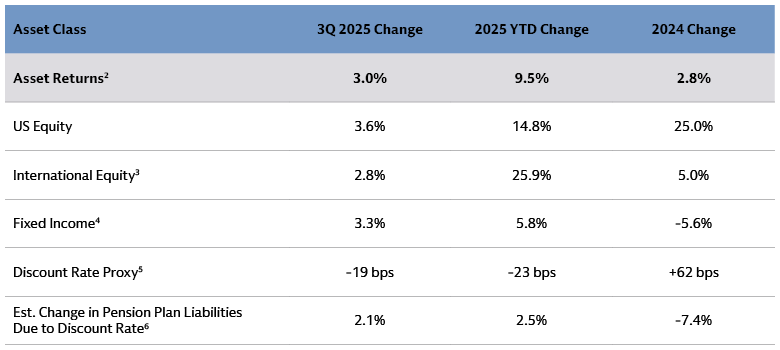
We estimate the aggregate funded status for the US corporate pension system ended the third quarter of 2025 at 105.7%, higher than our previous month-end estimate of 105.1% and quarter-end estimate of 104.4%. The Federal Reserve’s (Fed) resumed easing cycle paved the way for global equity markets to reach new highs in the quarter, more than offsetting a rise in estimated liability value driven by a drop in our discount rate proxy.

Source: MSCI, Bloomberg, and Goldman Sachs Asset Management. As of September 30, 2025. The August and September 2025 (E) figures are estimated and unaudited as of September 30, 2025, and subject to potentially significant revisions over time. Actual returns may vary significantly. The economic and market forecasts presented herein have been generated by Goldman Sachs Asset Management and Goldman Sachs Global Investment Research for informational purposes as of the date of this presentation. They are based on proprietary models and there can be no assurance that the forecasts will be achieved. Please see additional disclosures at the end of this presentation. Past performance does not predict future returns and does not guarantee future results, which may vary. GAAP funded status estimates are based on US plans (where specified) of defined pension plans within the S&P 500 (i.e., 229 companies with pension data per GS Asset Management analysis).

Our quarterly market recap & outlook
- The Fed lowered the federal funds rate by 0.25% to 4.00% - 4.25% in its September meeting, representing its first rate cut since December 2024 and the fourth in the current easing cycle.
- In response to the Fed rate cut, US equities rose to all-time highs. Year-to-date, the S&P 500 has gone through over 107 sessions without posting a drop of at least 2%, its longest streak since July 2024. Outside of the US, international equity markets saw positive returns in response to resilient 2Q earnings.
- US Investment Grade (IG) credit spreads tightened to 71bps in 3Q, the narrowest since 1998, as the risk-on sentiment extended beyond equities. US Treasuries initially rallied post-Fed meeting but yields later edged higher due to robust US economic data and the narrow split among Federal Open Market Committee (FOMC) members regarding the number of additional rate cuts in 2025.
- Our Fixed Income US economist forecasts two additional 25 basis point US Fed rate cuts this year in October and December and notes the Fed’s focus on monitoring the downside risks to a weakening labor market.
Portfolio Manager Perspectives
We sat down with Stephen Waxman, Head of IG Research in our Fixed Income franchise, to ask him his top five questions he gets from clients, discuss the factors driving higher IG supply, the team’s outlook, and its potential implications for US corporate pension plans.
Q1. As we look forward to 2026, what is your outlook for IG supply next year?
We think there is the potential for net supply to increase to $650bn in 2026, an active year for the US Dollar IG market in absolute terms, compared to the 10-year average of about $500bn, but in line with longer-term trends at 9% of current index par outstanding. We believe there are three factors driving this increase. First, the cycle, which we think remains healthy; second, looser regulation, which incentivizes M&A but also may lead to a lower pace of issuance from the banking sector; and third, capital spending, notably from select AI hyperscalers and the utility sector.
Q2. What are the factors that you are looking for that may determine the amount of issuance we will see next year?
We believe many IG issuers possess financial flexibility to manage their balance sheet debt, since most non-financial corporations typically generate positive free cash flow. Their decisions to increase debt are primarily driven by two factors. First, maintaining an optimal capital structure as usually expressed by their debt-to-EBITDA ratios, or second, financing discretionary activities such as M&A and share repurchases.
On a sectoral basis, in Banking, loan growth and deregulation are two primary drivers of issuance. A reduction in capital requirements may lead to reduced issuance needs for Global Systematically Important Banks (G-SIBs), all else equal.
For Utilities, we expect companies to continue to tap corporate bond and hybrid markets to fund cash flow shortfalls, and firms’ effort to chase datacenter opportunities may add to capex budgets with new debt likely issued to finance at least part of this increase.
For IG-rated Technology, we continue to foresee hyperscalers increasing capital spending, partly funded by reducing share buybacks, to grow their AI footprint. A key consideration for these firms is the balance between longer term investment and immediate returns in the form of cash flow to shareholders.
We also think some hyperscalers will look tap multiple sources of funding as they build out their datacenter footprint. This may include public corporate debt, but we also expect them to tap private and structured markets.
Q3. Do you think management teams will sacrifice their IG ratings?
We do not. Since the Global Financial Crisis, many IG firms have been reluctant to voluntary move to high-yield and have wanted to maintain some cushion within IG, but a downward migration within IG remains possible. We think that select A-rated non-financial firms may be willing to move into the BBB category. That said, we have seen some M&A transactions structured in a manner to maintain A ratings. Additionally, a potentially more active leveraged buyout market may lead to a loss of IG ratings for target companies, though the impact on bondholders remains dependent on a deal’s financing structure, as well as bond covenants.
Q4. Should IG investors be concerned about an increase in supply?
Not necessarily. We think supply is a function of a healthy market. Most IG non-financials do not need to issue if they don’t want to, and activities like M&A and buybacks tend to be pro-cyclical. We would be more concerned if companies continue to add debt and leverage in an environment of weaker growth and / or falling profits. We also monitor the potential for exogenous shocks or Fed policy errors.
Q5. What should corporate DB plans make of all of this?
Investment grade bonds provide the best match for a corporate DB plan’s liabilities as yields on these instruments are the benchmarks for the discount rates used for the calculation of pension obligations. If increased supply led to a widening of spreads and higher yields, the value of a plan’s fixed income holdings would decline. However, the value of its pension liabilities would fall as well given the ability to use a higher discount rate. In addition, increased supply could add a greater variety of IG instruments to the market, allowing a plan sponsor to better diversify its holdings. All of this underscores the importance of having an active fixed income manager that can navigate the implications of potentially increased supply and wider credit spreads.
Strategy in Focus
Investment grade (IG) corporate credit
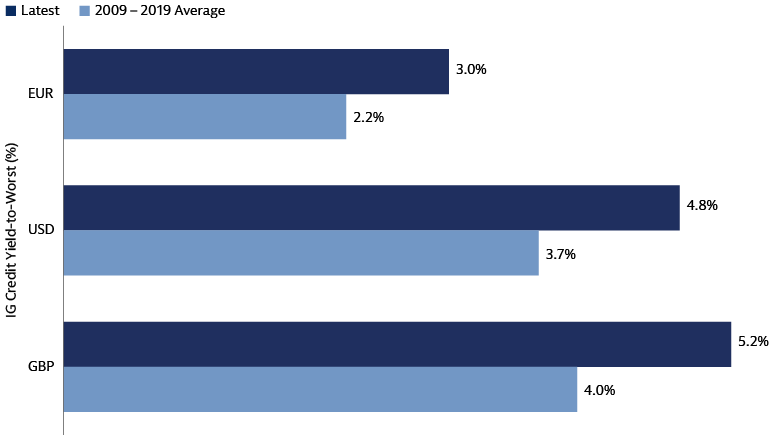
IG credit may offer high-quality sources of income and capital preservation in volatile markets due to its low default risk and resilient fundamentals, as well as a deep and diverse investment opportunity set. For corporate pension plans considering ways to diversify and enhance yield potentials in their portfolios, IG credit may be positioned well due to its decade-high total return potential and resilience against downside growth risks.

Left source: Macrobond, ICE BoFAML. As of October 13, 2025. Past performance does not predict future returns and does not guarantee future results, which may vary.

Right source: Bloomberg. As of October 2025. Equity downturn periods defined by a 10% decline in the MSCI World Index (“Global Equity” data series). “Global IG” refers to the Bloomberg Global Aggregate Corporate Index; “Global HY” refers to the Bloomberg Global High Yield Index. Past performance does not predict future returns and does not guarantee future results, which may vary.
The Case for IG Corporate Credit
- Rise in IG credit yields were driven by higher interest rates. We believe these historically attractive yields provide appealing income and offer total return potential.
- IG credit fundamentals remain strong and resilient even in the face of tariff pressures.
Focus on Active Alpha Generation versus Passive Beta Exposure
- Trade policy uncertainty will likely keep markets volatile and create performance differences among companies based on tariff sensitivity. The large, diverse global IG corporate credit market offers diversification across sectors and geographies, and a potential influx of IG bond supply may broaden out the investable universe further.
- Active investors may have opportunities to build diversified portfolios that may display resilience to market volatility and exogenous shocks like tariffs. We focus on distinguishing companies with sound fundamentals from those on a deteriorating path to navigate.
In the News
Goldman Sachs Asset Management Announcement Relating to Shell’s Pensions
- In September, Goldman Sachs Asset Management announced its appointment by various pension entities and a captive insurance company related to Shell Plc and its subsidiaries to manage a $40 billion mandate for international pension plan assets in Europe and provide advisory services for pension plans in North America.
- The outsourced chief investment officer (OCIO) agreements include $15.6 billion in the U.K. and $2.8 billion in Germany. Some of the mandates include management of liability-driven and cashflow-driven investment strategies.
Updates on Selected Recent Pension Risk Transfer (PRT) Lawsuits
- Recently, a US District Court granted a motion to dismiss a lawsuit against AT&T and State Street Investment Management which alleged violation of ERISA’s fiduciary duties in regard to a PRT transaction.
- Another US District Court recently denied a motion to dismiss in a lawsuit against Bristol-Myers Squibb Co. and State Street Investment Management that made similar allegations regarding a PRT transaction.
- In March, one complaint against Alcoa was dismissed, and another against Lockheed Martin was allowed to proceed past a motion to dismiss.
- While these lawsuits are case-specific in nature, the selected varying outcomes summarized above underscore the complex and evolving legal landscape surrounding PRT transactions and scrutiny of fiduciary responsibilities surrounding these transactions.
Select Pension Plan Actions Announced
- In September, Dayforce Inc. disclosed in its Form 8-K filing that it signed an agreement to purchase a group annuity contract from two Nationwide Financial subsidiaries to transfer all of its pension plan assets and liabilities, effectively terminating the company’s pension plans. The pension plan, with total assets of $320 million at the end of 2024, has been frozen to new benefit accruals since 2007.
- Also in September, Unisys Corp. announced that it purchased a group annuity contract from two F&G Annuities & Life to transfer $320 million in US pension liabilities, covering benefit payment to around 3,150 retirees and beneficiaries. The transaction represents the sixth pension buyout from the company since 2021, with the most recent from April 2024.
Annuitization Transactions Slowed in 2Q 2025
The Life Insurance Marketing and Research Association (“LIMRA”) reported that there were 122 single-premium pension buy-out transactions in 2Q 2025 (down 33% compared to the second quarter of 2024) for a total of $3.7 billion in transaction amount. 7

Source: LIMRA Group Annuity Risk Transfer Survey. As of 2Q 2025, the latest available as of publication.
According to LIMRA, higher economic volatility, elevated litigation concerns, and a lack of jumbo transactions were all factors contributing to the dampened pension risk transfer market for the quarter.
In the News sources include news releases, company reports, and Goldman Sachs Asset Management. As of September 30, 2025. Any reference to a specific company or security does not constitute a recommendation to buy, sell, hold or directly invest in the company or its securities. Please see additional disclosures at the end of this presentation. Company names and logos, excluding those of Goldman Sachs and any of its affiliates, are trademarks or registered trademarks of their respective holders. Use by Goldman Sachs does not imply or suggest a sponsorship, endorsement or affiliation.
* Source: LIMRA Group Annuity Risk Transfer Survey. As of 2Q 2025, the latest available as of publication.
2 Average asset-weighted return of S&P 500 companies’ US defined benefit plans. For 2024, uses average asset returns based on disclosed data. When not disclosed, estimates asset returns based on actual asset returns (in dollars) and average asset value.
3 Mix of MSCI EAFE and MSCI ACWI ex-US.
4 Mix of Corporates (Bloomberg US Aggregate Bond Index), High Yield (Bloomberg US High Yield), Treasuries, and Long Credit (Bloomberg Long US Credit).
5 Discount rate proxy measured by 50% Moody’s AA Corporate Bond and 50% US Long Duration Corporate Bond. For 2024, uses average discount rate change for December year-end filers.
6 Estimated Change in Plan Liabilities based on increase in estimated discount rate and duration of 11. For 2025, uses average actuarial gains / losses as a percentage of starting Projected Benefit Obligation
7 Source: LIMRA Group Annuity Risk Transfer Survey. As of 2Q 2025, the latest available as of publication.
