Municipal Fixed Income Monthly May 2026

Strong Muni Demand Drives Positive Momentum
Munis outperformed Treasuries amid inflation repricing concerns. With elevated supply and tight spreads, rigorous credit selection and duration positioning are key to capturing income amid shifting technicals, exemplifying active management’s role in 2026.
Market Overview
The municipal bond (muni) market outperformed the Treasury market in May as strong investment demand anchored muni yields while Treasury yields rose. Inflation repricing and shifting Fed policy expectations drove the selloff, with inflation pass-through from the Middle East conflict pushing headline CPI to +3.81% YoY and core CPI to +2.75% YoY. The labor market held steady with unemployment unchanged at 4.3%. Inflation pressures led to a rate hike narrative in the market, fueling the rise in Treasury yields, while sustained muni inflows kept yields contained, driving outperformance versus Treasuries.
Yields and Valuations
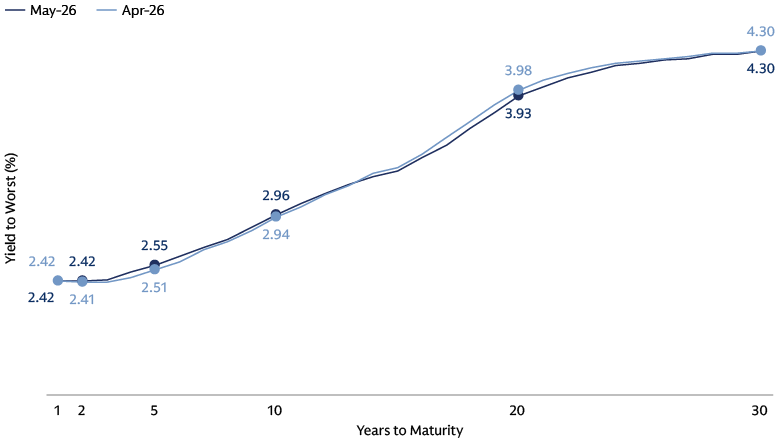
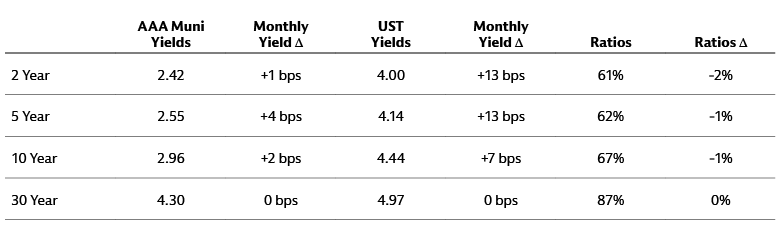
Muni yields twisted with the front end rising and back end falling in May. The difference between 1-year and 30-year muni yields remained flat at 187 bps. Muni/US Treasury ratios richened by 1/1/0%, ending May at 62/67/87% respectively for 5/10/30 years.
Source: Goldman Sachs Asset Management. Bloomberg. As of May 31, 2026.
Source: Goldman Sachs Asset Management. Bloomberg. As of May 31, 2026.
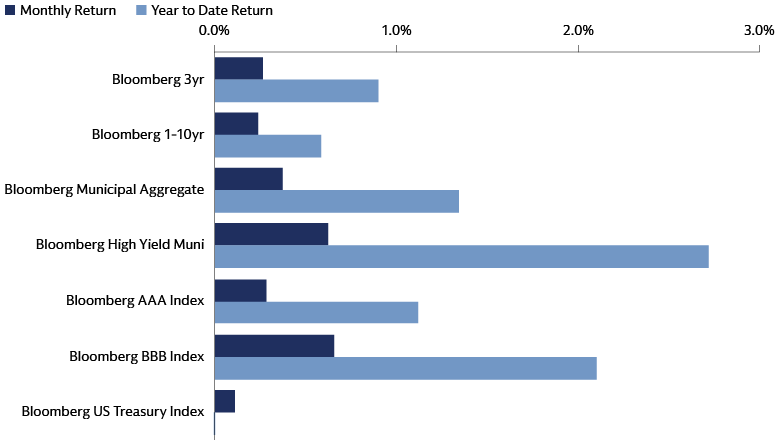
Muni Index Performance
The Bloomberg Muni Index returned 0.37% in May, while the Bloomberg Muni High Yield Index increased by 0.62%. All credit ratings (AAA–BBB) saw positive performance within investment grade munis.
Source: Goldman Sachs Asset Management. Bloomberg. As of May 31, 2026.
Credit Research Spotlight
- New York City Mayor Mamdani released an updated budget for fiscal 2027 that closed the prior gap without an increase in income taxes or tapping into the city’s reserves.
- The updated budget closes the gap using a combination of cost savings, increased state aid, a new surcharge on second homes and deferral of some pension payments.
- While rating agencies will likely view the maintenance of the city’s reserves as positive, the reliance on one-time state aid measures and pension restructuring will likely be viewed less favorably.
Supply for the end of the quarter should remain elevated given continued infrastructure needs. We expect demand to persist over the quarter due to strong summer reinvestment and attractive absolute yields.
Ratios are fairly valued and credit spreads are at 5-year historical averages. We see opportunity to lock in attractive absolute yields amid rate volatility as credit fundamentals support current spread levels.
Headline-driven volatility is still present though the combination of a resilient underlying economy and healthy reserve balances continues to put municipalities in a strong position to navigate the path forward.
Supply: Persistent
May new issue supply amounted to $51 billion ($49 billion tax-exempt and $2 billion taxable). This was 3% lower than May 2025 volumes and 2% lower than April. Year to date, new issue volumes are up 5% versus last year.
Weekly new issuance volumes in May ranged from $9 billion to $14 billion. Notable deals included $2.1 billion New York Transitional Finance Authority, $1.2 billion Dormitory Authority of the State of New York, and $1.1 billion Airport Commission of San Francisco.
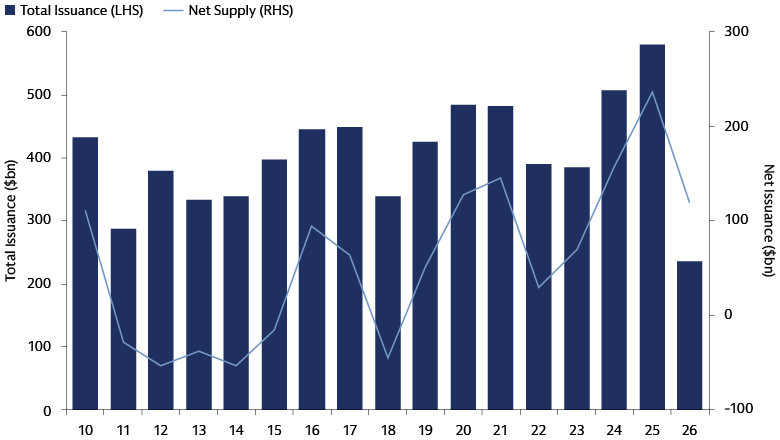
Source: Goldman Sachs Asset Management. The Bond Buyer, Barclays. As of May 31, 2026.
Demand: Very Strong
May had positive inflows for all four weeks. The last week of the month saw $2.3 billion of inflows, the second largest weekly inflow on record. On average, each week had $1.7 billion worth of inflows based on weekly reporters’ data.
May saw robust demand for investment grade and long duration munis. Year-to-date fund inflows have totaled $45 billion, the second-highest recorded level for this period, with the majority of flows into investment grade and long duration munis.
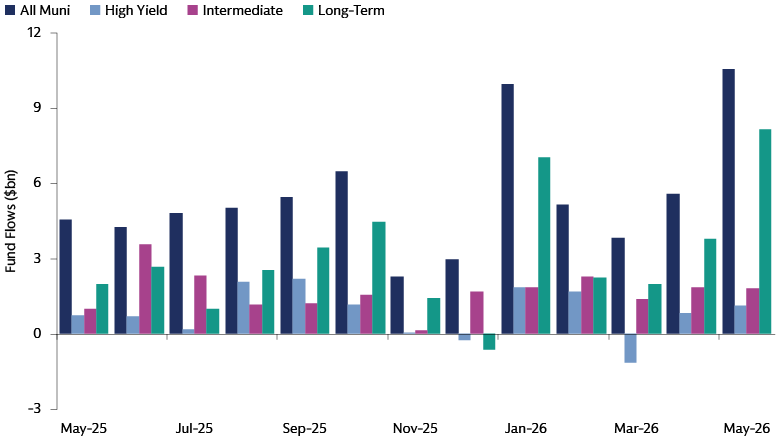
Source: Goldman Sachs Asset Management. Refinitiv. As of May 31, 2026.
Spreads: Tighter
Investment grade and high yield spreads both tightened 3 bps in May, finishing at 95 bps and 185 bps, respectively.
Within high yield, all sectors showed positive performance. Puerto Rico, Water & Sewer, and Special Tax had the strongest performance, returning 1.54%, 1.05%, and 1.04%, respectively.
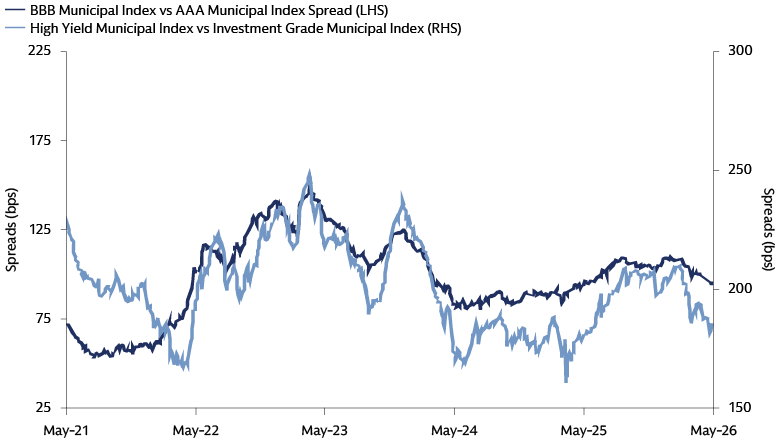
Source: Goldman Sachs Asset Management, Bloomberg. As of May 31, 2026.