Municipal Quarterly Review and Outlook 2Q 2025
Weathering the Storm
Municipal bonds began the second quarter on a difficult note due to a combination of heavy supply, tax-season related selling, record outflows, and ongoing scrutiny of the market’s tax-exempt status. In addition, tariff-related volatility was not kind to munis as the downturn in the equity markets led to investors re-balancing out of munis and into equities. However, May and June brought stability and positive returns to the market. A combination of positive factors—inflows, investors pre-spending elevated summertime re-investment capital, and positive news regarding preserving the tax exemption—created a constructive market environment for municipal bonds.
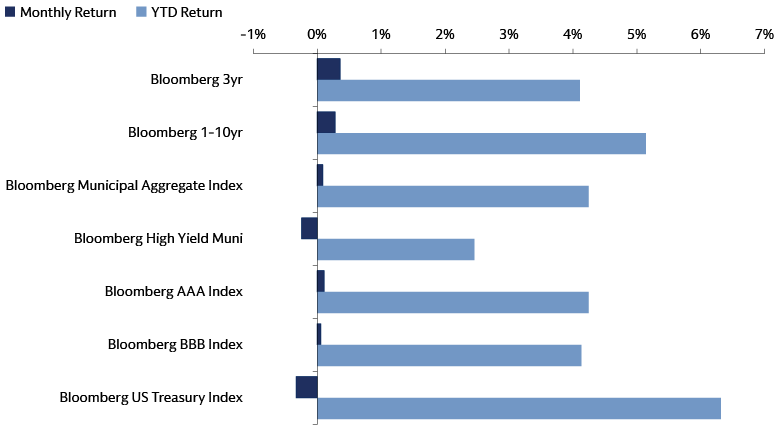
April had negative returns of –0.81%; however, May and June combined to return 0.69% which almost reversed the negative performance of April. For the quarter, the Bloomberg Muni Bond Index returned -0.12%. The Bloomberg Municipal High Yield and Taxable Indices returned –1.14% and 0.81%, respectively, in 2Q 2025.
The 10-year Treasury yield mainly rose in April and peaked at 4.60% in late May. It then proceeded to generally fall during the rest of the quarter due to lower-than-expected inflation readings, tariff deal progress, and geopolitical concerns in the Middle East. Munis saw their yields spike and peak in early April before going lower the rest of the quarter.
Munis had mixed performance versus Treasuries as benchmark muni yields fell in short and intermediate-term maturities but were materially higher in longer-term ones. The yield-to-worst on the Bloomberg 3yr Index ended the quarter 9bps lower at 2.97%. The Bloomberg 1-10 Index closed at 3.29%, 5bps lower, and the Bloomberg Muni Agg Index rose 11bps, reaching 3.96%.
Market Review
Primary market: Record pace accelerates
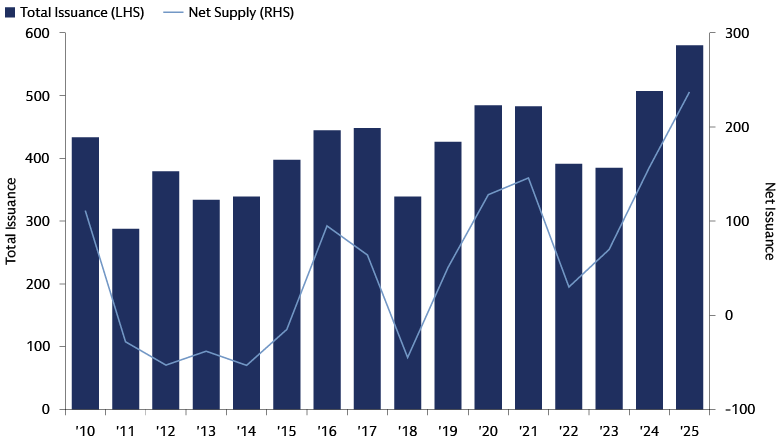
The pace of new issuance picked up steam in the second quarter and remained on a record-breaking pace to start the year. Municipal bond issuance in April and May were in-line with last year’s volumes. However, June’s volumes were 17% larger than June of 2024 and set a record for tax-exempt issuance for that month. Overall volume for the quarter was 14% higher than 2Q 2024 and 34% above the pace of 1Q 2025.

Source: Bloomberg, BVAL Muni. As of June 30, 2025.
Issuance volumes continue to be driven by deals for new projects, while refinancing activity remains more muted. The education sector was active as both public and private universities brought large deals to the market. States, cities, and hospitals also brought billion-dollar sized deals. The month of June was notable in that it had two weeks that were above or close to $20 billion in total issuance per week. These weeks ranked as some of the largest weeks in municipal market history.
Despite the record supply and macroeconomic volatility, the new issue markets were generally orderly, and most deals were able to be placed throughout the quarter. As volumes have exceeded market expectations, market prognosticators have been revising their supply forecasts higher. Forecasts made at the end of last year were calling for supply in the lower $500 billion range, while more recent revisions have 2025 volumes finishing the year in the mid-to-high $500 billion range.

Source: Bloomberg, Bond Buyer. As of March 31, 2025.
Demand: Choppy, but ultimately positive
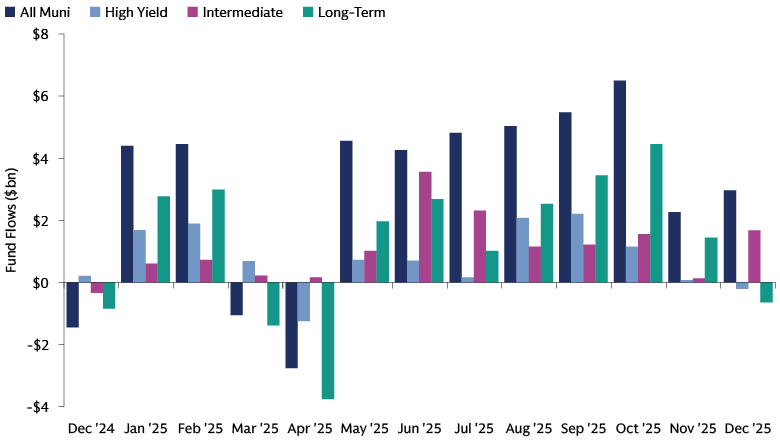
Municipal funds began the quarter suffering severe outflows due to tax season selling and tariff-related volatility. The outflow cycle was highlighted by a single week's outflow of $3.3 billion―the largest outflow recorded in over two years. That week also marked the highest level of outflows ever recorded for municipal ETFs. As the volatility settled down and tax season passed, investors re-engaged with the muni market and began adding to their muni exposure. May and June witnessed consistently positive inflows each week as long-term and high yield funds garnered strong inflows. In aggregate, 2Q 2025 amounted to $5 billion of inflows, a slowdown of inflows related to the last quarter. Long-term and high yield funds garnered a disproportionate share of the inflows. Year to date, muni fund inflows have totaled close to $10 billion, with the majority of the inflows going into ETFs.

Source: Lipper. As of June 30, 2025.
Valuation and yield changes: Mixed performance across the curve
Yields were historically volatile to start the second quarter as the second week of April saw AAA municipal yields rise 100bps in a matter of days and then retraced half that move in one day. Municipals proceeded to have their worst day in terms of total return in at least 30 years followed by their best day in 30 years. After that initial spike in yields due to tariff-related volatility, municipal yields generally fell the rest of the quarter. In May, yields fell by an average of 7bps, with municipal bonds outperforming the yield increase in Treasuries. In June, muni yields fell by 13bps, moving similarly to Treasury yields.
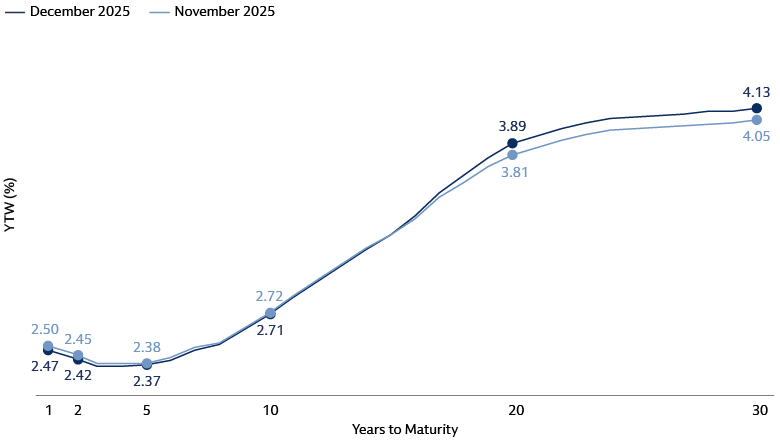
For the quarter, triple-A tax-exempt muni yields fell 5bps and 15bps in 2 and 5-year tenors, were unchanged in the 10-year tenor, and rose 26bps in 30-year tenors. Treasuries fell 15bps in 2 and 5-year tenors, but increased 2bps and 20bps in 10 and 30-year tenors. Muni/UST ratios were mixed across the curve, with 2yr and 30yr ratios increasing to 71% and 91%, while 5yr and 10yr ratios decreased to 72% and 75%, respectively.

Source: Federal Reserve Board Flow of Funds data, BofA Merrill Lynch Global Research. As of 1Q25, latest available.
Yield curve: Steepens as long maturities underperform
Longer maturities exhibited the weakest relative performance during the first quarter. The 30-year segment of the municipal yield curve experienced significant underperformance, with its yield rising by 26bps, while short maturities recorded a decrease in yields by 10bps on average.
The difference between 2- and 30-year tax-exempt muni yields increased by 31bps, ending the quarter with a slope of 188bps. The middle curve (5 to 10-year maturities) steepened by 15bps, finishing with a slope of 49bps.

Source: BVAL Muni. As of June 30, 2025.
Investment grade index returns and spreads: Slightly negative with some bright spots
The Bloomberg Municipal Bond Index returned -0.12% during 2Q 2025. The 1-10 Year Blend Index posted a total return of 1.04%, while the 3-year Index returned 1.05%.
Within investment grade credit, the 'AA' segment of the municipal index recorded the highest relative returns at –0.04%, whereas the 'BBB' segment showed the weakest performance with a return of -0.64%. From a yield curve perspective, the 5-year Index achieved the best performance with a return of 1.35%, while the 22+ year Index experienced the lowest return at -1.94%.
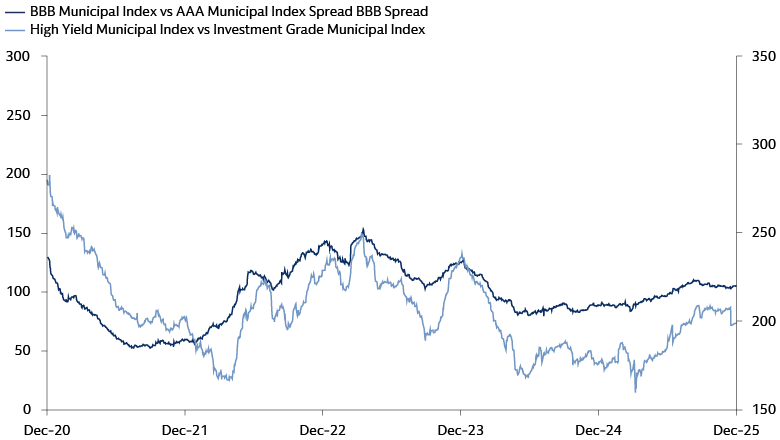
BBB-AAA credit spreads widened by 11bps to end the quarter at 97bps. BBB-AAA credit spreads have averaged 118bps over the last 10 years but have also reached levels as low as 54bps.
High yield municipals: Underperformance due to longer duration and wider spreads
The high yield municipal market, represented by the Bloomberg Municipal High Yield Index, posted a return of –1.14% over the quarter, underperforming the investment grade index by 104bps―the first quarter in two years that it has underperformed IG.
Within high yield municipals, transportation and airline credits were the best performers—posting total returns of 0.23% to 0.20% for 2Q 2025. Tobacco and Puerto Rico credits were relative underperformers, returning –4.58% and –2.47% respectively for the quarter.
Within the HY municipal index, the 2-4 year maturity area of the curve outperformed—returning 1.33%, while the 20-year and 22+ year index underperformed returning –2.23% and –1.32% respectively for the quarter.
High yield spreads increased by 11bps during the quarter and ended June at 185bps. High yield credit spreads have averaged 266bps over the last ten years but also reached levels as low as 161bps during this past April.

Source: BVAL Muni. As of June 30, 2025.
While some sector-wide challenges have begun to take shape, we continue to believe that the majority of distressed situations will remain one-off in nature given the idiosyncratic nature of municipal credit. Underlying credit quality remains solid across a number of sub-sectors and obligors, providing for a strong fundamental base for this portion of the market. Demand continued its positive trend over the quarter as well, as high yield funds saw inflows of $192mm, representing positive flows relative to the comparatively smaller size of this asset class.
Taxable municipal market: Positive returns driven by income
The taxable municipal market, as represented by the Bloomberg Taxable Muni Index, posted a total return of 0.81% during 2Q 2025, outperforming the tax-exempt investment grade index by 93bps. Positive returns were driven mainly by coupon income as Treasury yields and spreads were relatively flat during the quarter.
Credit spreads tightened by 1bp as the difference between the Bloomberg Taxable Municipal Index and the 10-year Treasury ended the quarter at 76bps―still within reach of the tightest spreads the market has seen in its history. Taxable muni issuance was 10% lower than over the same quarter in 2024, but significantly larger than the first quarter as the university sector brought sizeable deals.

Source: Bloomberg, Goldman Sachs Asset Management, Barclays. As of June 30, 2025
Municipal Credit Update
State budgets for fiscal year 2026
Forty-six states begin their fiscal year on July 1st and as of this writing, only three states had not fully enacted their FY 2026 budgets - Pennsylvania, North Carolina and Oregon (pending Governor’s approval). Importantly, all three have automatic spending mechanisms in place to provide for the continuity of government and debt service payments. Overall, state financials remain on a solid footing. In fact, the majority of states are budgeting for their rainy day funds to remain at historical highs.
Heading into fiscal year 2026, states projected a fourth consecutive year of moderate general fund revenue growth, estimated at 2.8% year-over-year. This expectation highlights the critical need for prudent expenditure management across state governments. To mitigate the risk of structural budgetary imbalances, many states have strategically employed measures such as targeted program reductions and, in certain instances, hiring freezes. Furthermore, some states have pursued tax increases where politically feasible. Given that most states finalized their budgets before the enactment of the Trump Administration’s “One Big Beautiful Bill,” the ultimate fiscal impact of subsequent federal funding adjustments remains unclear and necessitates diligent monitoring.
Sources: National Conference of State Legislatures, National Association of State Budget Officers – Fiscal Survey of States, Spring 2025
Federal budget and impact on not-for-profit hospitals
The recently enacted legislation introduced changes to Medicaid that could present headwinds for the not-for-profit hospital sector, with federal Medicaid spending expected to be reduced by $1 trillion. These changes could affect hospital revenues, particularly for those facilities more reliant on Medicaid reimbursements. Key provisions include adjustments to Medicaid eligibility criteria and a gradual reduction in provider taxes, which are important mechanisms for states to draw down federal matching funds. To partially offset the impact, the bill allocates funds specifically for rural hospitals.
The full financial impact on the sector is still unfolding. The phased implementation of these changes potentially provides hospitals and state legislatures time to adapt and partially offset some of the negative effects. States may also have opportunities to implement strategies to partially compensate for the reduction in federal funding.
Importantly, the not-for-profit hospital sector has demonstrated improved profitability over the past year, partially recovering from pandemic-related challenges. The improved profitability provides a more stable foundation as hospitals navigate these upcoming changes. While the Medicaid adjustments introduce uncertainty, the sector's recent performance and the extended implementation timeline may give management teams greater runway to adjust to these challenges. As these changes take effect, we will continue to monitor their impact on the financial health of not-for-profit hospitals
Sources: Kaufman Hall, Moody’s
Credit quality trends in the first half of 2025: A slowdown in upgrades
The pace of credit upgrades decreased in the first half of 2025, with the combined upgrade-to-downgrade ratio for Moody's and S&P remaining positive, albeit reduced to 1.1x. This contrasts with a stronger ratio of 1.9x during the same period in 2024. S&P has had a more significant shift, with downgrades exceeding upgrades in four of the past six months. Moody's has maintained a more optimistic trend, although the agency has assigned Negative Outlooks to several key sectors. In the last quarter, Moody's revised its outlook to Negative for Not-for-Profit Organizations, Airports, and Ports, adding to the Higher Education sector's Negative Outlook assigned earlier in the year.
As highlighted in our previous quarterly analysis, the higher education sector has been particularly affected by negative rating actions. Both Moody's and S&P continue to downgrade universities at a significantly higher rate than upgrades. This trend is largely attributable to evolving demographic trends, escalating cost pressures, and shifts in federal policy.
Sources: S&P, Moody’s, Goldman Sachs Asset Management
Municipal bond default update: Mid-year 2025 analysis
During the first half of 2025, the par amount of first-time municipal bond defaults was up 23% year-over-year. However, on an annualized basis, defaults align with established historical trends, particularly when viewed from a sector-specific perspective. Senior living, “project finance” and proton therapy collectively accounted for the largest percentage of defaulted par year-to-date, accounting for 80% compared to 73% during the same time period last year.
While occupancy levels at Continuing Care Retirement Communities (CCRCs) have recovered substantially following the global pandemic, senior living credits generally walk a financial tightrope of thin margins, high leverage and limited cash reserves, making them particularly vulnerable to economic downturns or unexpected operational challenges. Project finance transactions are often complex credits that involve construction, technology and operational risk―each of which can create material financial challenges in their own right. Lastly, despite making up a small segment of the high-yield municipal bond universe, proton therapy bonds have experienced a disproportionately high rate of default that can be attributed to patient volume shortfalls and reimbursement rate underperformance.

Sources: Bloomberg, BAML, Goldman Sachs Asset Management
Notable Mentions and Market Movers

- White House announces reciprocal global tariffs
- Municipal yields rise 100bps over a few days, then retraced half the increase over the next few days
- Muni market has worst daily performance and then has its best daily performance all in the same week
- Muni ETFs suffer largest weekly outflow in their history

- CPI readings below consensus
- The House reconciliation bill proposal left the municipal market’s tax-exempt status intact
- Moody’s downgrades the U.S.’s sovereign rating from Aaa to Aa1
- The FOMC left the target range for the federal funds unchanged at 4.25-4.50%

- Escalating conflict in the Middle East
- Core CPI comes in below expectations
- FOMC holds rates steady and reiterates that it can be patient while waiting for further economic clarity
- Municipal market has two weeks of close to record supply
Municipal Market Outlook
Supply/Demand: Primary market supply, one of the major headwinds for the municipal market over the past 18 months, will continue to be a factor over the next quarter; however, we believe it is likely that volumes slow relative to the torrid pace we have witnessed during the first half of this year. Issuer concerns about losing their ability to borrow in the tax-exempt markets caused front-loading of issuance during the first half of the year. However, based on initial tax policy legislation it appears likely that the muni market’s tax-exempt status will be preserved. As we enter the “summer reinvestment season”, we expect elevated demand across investment vehicles―SMAs, Mutual Funds and ETFs―as investors and clients seek to put new monies and maturities back to work in the asset class. While additional new issue supply may dent the typical outperformance, we still expect municipals to perform well over the next quarter given this cyclical demand pattern and the starting point in yields today.
Valuations: We continue to see attractive income potential across the municipal bond landscape, even more so now after the yield adjustments in the intermediate and long end of the curve year-to-date. In our view, intermediate-maturity bond valuations are fair relative to recent history, and high-grade municipal yields in that area of the curve are now more than 100bps higher than the average over the past decade. Long-end maturities appear to be the most attractive given the comparative underperformance due to the yield curve steepening experienced during the prior quarter. While we see value in those bonds, we are mindful that this potential weakness can endure through year-end.
Credit/Spreads: From a broader economic perspective, we continue to be mindful of impacts to municipal sectors such as higher education and hospitals where credit selection is acutely important. While headlines have garnered plenty of attention, the actual credit impact has been limited―but this bears close consideration in the months ahead. Given the diverse high yield municipal opportunity set, careful credit selection will be key. Our outlook calls for income to be the main driver of returns over the near term, and for credit spreads to remain range bound, therefore high yield exposure should be additive to overall portfolios for the year.