A Closer Look At Concentration
The Magnificent 71 stocks have captured both investor attention and S&P 500 market share in recent years, relentlessly driving index returns while simultaneously raising concerns for a frothy market and overexposure in the event of a technology drawdown. The S&P 500 Index holds about 28% of its market cap in these seven companies alone, surpassing concentration levels of even the height of the late 1990s dot com bubble.2 High concentration may introduce new risks as the index becomes more sensitive to the direction of these stocks. For instance, the Magnificent 7 inflicted the most pain during 2022’s equity drawdown, returning –39%, compared to –20% for the remaining S&P 500 companies.3
However, concentration alone, in our view, does not justify moving out of the big technology companies. The performance of today’s top companies has been underpinned by solid corporate balance sheets, strong earnings, and potential for robust future growth from AI-driven innovation. Today’s market concentration is not driven by the same speculative nature of market concentration during the dot com bubble. Prudent investors should therefore consider ways to maintain a diversified portfolio to mitigate idiosyncratic risk along with a bias towards quality in their portfolio. Large cap US exposures may be diversified with complementary sectors and geographies, as well as differentiated opportunities in private markets.
Similarly High Concentration, Different Conditions
The drivers of today’s high market concentration ultimately look much different from those of the early 1980s recession or the dot com bubble. Today, we believe hotter inflationary pressures and higher interest rates have enabled the index’s strongest business models to demonstrate their margin resilience, attracting investor flows and pushing their relative market caps higher. Most of the leaders of the S&P 500 today also reflect the clearest pathway to growth through technology and their relative ability to withstand a higher cost of capital and uncertain economic and geopolitical conditions. Context is essential, so to best understand the different drivers of concentration and drawdowns in the past, we’ve looked at the historical composition of the S&P 500, as well as the ongoing economic conditions and sentiment.
An early period of high S&P 500 concentration occurred during the 1970s and 1980s, when IBM dominated the index at about 6.4% of its market cap—modestly above Apple’s current weight of 5.8%. Although IBM’s introduction of the personal computer was groundbreaking, and other index leaders were the biggest names in the oil industry, their strengths were no match for Volcker’s rate-hiking campaign. The S&P 500 experienced a few market corrections in the early 1980s, driven largely by growth shocks and recessionary impulses as interest rates rose from 10% to nearly 20%. GDP entered negative territory for several months during this decade of harsh inflation-control. Ultimately, although market concentration and any overvaluation within the index during this time may have been a factor in the S&P 500 correction, the economic conditions outside of markets had the strongest influence on investor sentiment and stock performance.
The dot com bubble is a different story, driven by speculation and internet enthusiasm, only to be harshly corrected by a widespread failure to deliver sustainable business models and earnings growth. Surprisingly, most of the top seven companies back then do not share the speculative characteristics of the companies that drove the ballooning and eventual burst of the dot com bubble. General Electric, Exxon Mobil, Pfizer, Cisco, Citigroup, Walmart and Microsoft. Microsoft is in fact the largest company by index weight within today’s S&P 500 Index, and all other companies are major players in the index today. If the top 7 companies during the dot com bubble were solid and backed by fundamentals like today's Magnificent 7 companies, what may that mean for today’s index? A closer look at the historical composition of the index reveals two key data findings: 1) S&P 500 profit margins have nearly doubled over the past four decades and 2) S&P 500 returns during the late 1990s and early 2000s were more heavily weighted toward a wider range of companies, particularly companies backed by weaker fundamentals. From 1995 to 2000, the return attributions of the top 7 companies vs the top 100 companies to S&P 500 performance were 25% and 83%, respectively. Meanwhile, S&P 500 Index returns for the past five years from 2019 to 2024 were 49% driven by the Magnificent 7 and 89% driven by the top 100 companies.4 In other words, the dot com bubble saw a larger pool of companies with weaker fundamentals driving index returns. As we find ourselves today in a cycle of higher scrutiny on profitability and margins, the companies able to deliver these results have been rewarded the most, while others have lagged. Continued performance among the Mag 7 companies today will therefore depend on their ability to consistently deliver strong earnings and growth.
Elevated Rates Paving the Way for Active Management
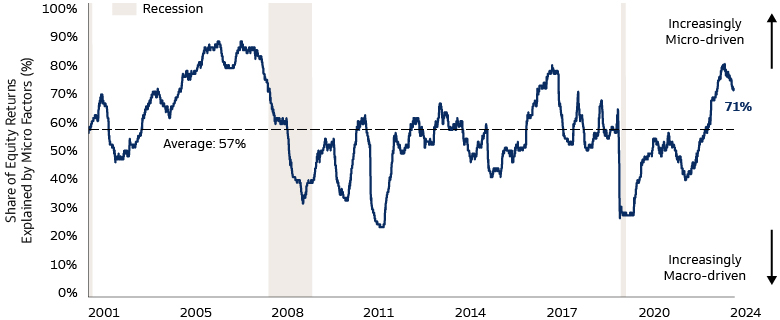
With the S&P 500 Index so concentrated among the largest names, the entire index valuation has been pulled higher with them, leading investors to look for alternatives and other means of diversification. Investors may find solutions by taking a more active approach and investing in individual sectors or names that are simultaneously backed by fundamentals and complementary to the Magnificent 7. We believe the current macro backdrop is also conducive for active management due to higher dispersion and decreasing correlation between stocks. As a result, we are seeing over 70% of returns explained by micro factors including earnings performance, board and management selection, and debt levels relative to an industry benchmark. We expect higher return potential among active managers who employ a variety of strategies to analyze these company-specific factors.

Source: GS Global Investment Research and Goldman Sachs Asset Management. As of February 29, 2024. Chart shows the share of the median S&P 500 stock's trailing 6-month return explained by micro factors. Micro factors refer to company specific sources of risk and return rather than macro factors such as market beta, sector beta, size, and valuation. Past performance does not predict future returns nor guarantee future results, which may vary. For illustrative purposes only.
Finding Magnificence Abroad: International Equities
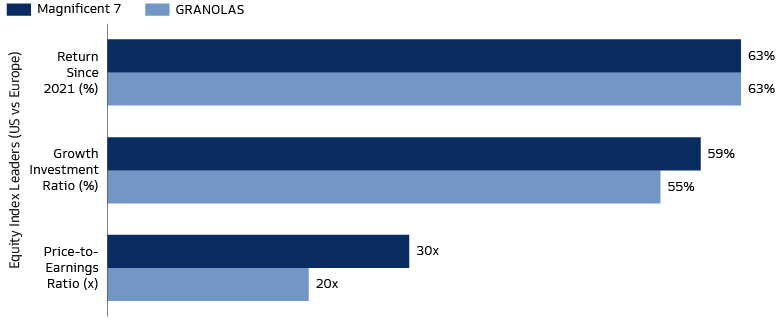
Strong companies and investment opportunities also exist outside of the US, with many top performers offering lower volatility and more diversification to sectors outside of technology. For example, Europe’s equity market is like the US in that it has been dominated by 11 companies: the GRANOLAS.5 These companies hold approximately one quarter of the STOXX Europe 600 Index’s market cap and contributed to over 50% of the index’s trailing twelve month returns, comparable to the Mag 7’s concentration levels and return attribution to the S&P 500 Index.6 While delivering the same performance as the Magnificent 7 since 2021, the GRANOLAS have done so with about half of the volatility and two-thirds of the valuation. There are top companies like the GRANOLAS across many other developed and emerging markets, such as Japan and India. As with the S&P 500 Index, underlying fundamentals are key, whether for choosing alternative indices to diversify or for taking on a higher tracking error and deviating from the benchmark.

Source: GS Global Investment Research and Goldman Sachs Asset Management. As of February 12, 2024. GRANOLAS refers to the 11 largest European companies by market capitalization. Past performance does not predict future returns nor guarantee future results, which may vary. For illustrative purposes only.
Private Investing Potential
As investors look to further diversify away from concentrated positions, the realm of private market investing reveals itself as a strong opportunity, in our view. Several factors contribute to an increasing share of opportunity within private market investing: 1) the universe of private companies has grown while that of public companies has shrunk, 2) companies have stayed private for longer, generating more of their value while under private ownership, and 3) the innovative nature of many private companies may bode well for building out the future of technology-driven economic potential. Easing monetary policy and an increased risk appetite among investors will be a pivotal opportunity for the beneficiaries of AI—the question now is when that will happen and whether those pieces will fall into place. While investors are now focused on balance sheet resilience and earnings during an era of higher cost of capital, we believe the next wave of growth may come from moving both down in market capitalization and into private investing. In today’s environment of rapid change, companies need to adapt to remain well-positioned for the future. For many companies, private ownership may be the preferred structure to effect transformation and improvement due to an active ownership approach and governance structure that closely aligns owners and management. We believe including private equity in a portfolio may also help diversify exposure across company size, sector composition, and stage of company development. As with active management in the public sphere, manager selection remains of the utmost importance in navigating a more complex investing environment, and investors should consider the manager’s skillset in creating fundamental value in their portfolio companies.
Zooming Out
It feels uncomfortable to see an index of 500 companies leave a quarter of its market cap to the fate of seven companies alone, as history has revealed some drawdowns following periods of high concentration levels. However, concentration in today’s market environment does not suggest a coming drawdown but rather showcases companies that have demonstrated resilient balance sheets and are at the forefront of growth in the technology sector. Instead of cashing out of strong companies and indices, we look to enhance portfolio diversification within other overlooked areas of the market that are supported by similarly strong fundamentals.
1 Magnificent 7 refers to Nvidia, Microsoft, Google, Meta, Tesla, Apple, and Amazon.
2 Source: Bloomberg and Goldman Sachs Asset Management. As of February 29, 2024.
3 Source: Bloomberg and Goldman Sachs Asset Management. As of December 31, 2022.
4 Source: Bloomberg and Goldman Sachs Asset Management. As of February 27, 2024.
5 GRANOLAS refers to the 11 largest European companies by market capitalization and includes GlaxoSmithKline, Roche, ASML, Nestle, Novartis, Novo Nordisk, L’Oreal, LVMH, AstraZeneca, SAP, and Sanofi.
6 Source: Goldman Sachs Global Investment Research and Goldman Sachs Asset Management. As of February 12, 2024.
