Exploring Investors’ Concerns About Equity Market Concentration

Dramatic recent advances in artificial intelligence (AI) and the performance of hyperscaler stocks have heightened investors’ concerns about equity market concentration. This issue is most pronounced in the US, where the top 10 stocks in the S&P 500 Index – led by technology giants including Nvidia, Apple, and Microsoft – account for 36.5% of the index by market capitalization.1 The US is not alone, however. Equity market concentration is also near a record high in emerging markets. In developed markets excluding the US, by contrast, concentration peaked in the late 1990s and has largely followed a downward trajectory ever since.2 Yet with US equities accounting for the largest share of the global market, index concentration is a pressing concern for investors around the world.
In addition to their soaring market capitalizations and index weights, US and emerging-market mega-cap stocks have outperformed the rest of their markets in recent years, amplifying their impact. In 2025, for example, the top tech stocks accounted for 53% of the S&P 500’s return.3 This was not always the case. The top 10 US stocks by market cap lagged the performance of their smaller peers for years following the dot-com bubble in the late 1990s and only began to outperform during the past 10 years. In developed markets excluding the US, however, the top 10 stocks have lagged the broader market for decades.4
This combination of elevated concentration and narrow market leadership poses a range of risks for investors, including greater sensitivity to earnings disappointment and the increased probability of a disorderly market correction. These risks have come into focus again in 2026, with the so-called Magnificent 7 stocks underperforming the broader market.5 In a rotational environment like this, passively managed tracking strategies replicate the level of concentration in their indices, leaving investors exposed to any resulting market risks, while active strategies differ in their ability to manage the risks.
In our work with clients around the world, we are fielding an increasing number of questions about index concentration as a portfolio-management challenge. One concern that has arisen is that an increasing weight of mega-cap stocks could drive increased volatility along with decreased index diversification. A second concern shared by many investors is that index concentration could be a sign that mega-cap stocks – and thus a significant portion of the overall equity market – are overvalued and could be a drag on future market appreciation. A third concern focuses on the potential for elevated index concentration to diminish the efficiency of active long-only equity strategies. To respond to these questions, we analyzed these issues to provide a clearer understanding of the market dynamics.
Index Concentration Affects Investors Around the World
The problem of equity index concentration has become increasingly acute over the past decade. In the US, the weight of the top 10 stocks has risen sharply over the past decade, as discussed above. Emerging market equities have followed a similar upward trend. In the MSCI Emerging Markets Index, which covers 24 countries including Brazil, China, Taiwan, South Korea, and India, the weight of the top 10 stocks soared during the COVID-19 pandemic, then declined over the next two years before rebounding, and now stands at about 32%. Two companies – Taiwan Semiconductor Manufacturing and Samsung Electronics – account for nearly a fifth of the index.6
The story is different in developed markets outside the US, with the weight of the top 10 stocks in the MSCI World ex USA Index fluctuating between 10% and 15% for the past two decades. The top 10 constituents now account for 12% of the index.7 While this is a third of the concentration level in the S&P 500, it remains a factor that investors should consider in constructing their portfolios, in our view.
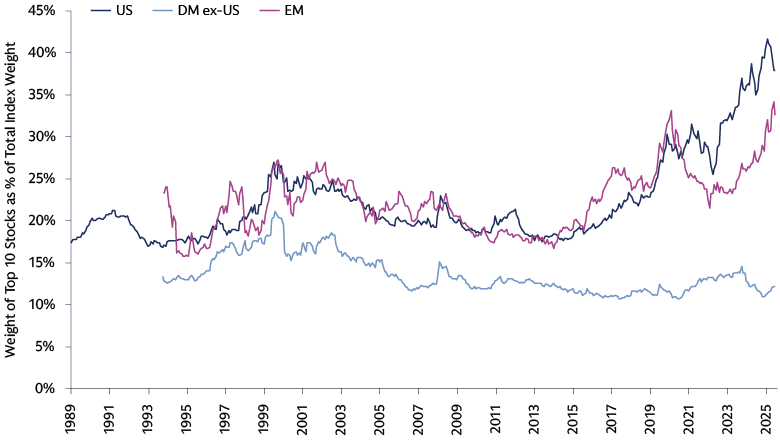
Source: Goldman Sachs Asset Management, S&P Global, MSCI. As of March 2026. The chart uses equity indices as proxies for their respective markets: the S&P 500 for the US, the MSCI World ex USA Index for developed markets excluding the US, and the MSCI Emerging Markets Index for emerging markets. The time periods covered vary by index. The data began in November 1989 for the S&P 500, in July 1994 for the MSCI World ex USA Index, and in August 1994 for the MSCI Emerging Markets Index. The coverage period ends on March 2026, for all three indices.
Index Concentration Has No Clear Connection to Market Volatility
One concern our clients have raised about index concentration is related to the potential effect that a small number of large positions could have on market volatility. As the weight of mega-cap stocks increases, the stock-specific contribution to volatility could increase while the diversification of the index decreases. In this case, we would expect the volatility of an index that includes the top 10 stocks to be higher than the volatility of the index without them.
We examined the volatility ratios of the three indices over time. A ratio that is above 1.0 indicates that the inclusion of mega-cap stocks exacerbates market volatility, and a ratio below this level indicates mitigation. A ratio of exactly 1.0 means the inclusion or exclusion of mega-cap stocks has no meaningful impact on market volatility.
For the S&P 500, the ratio over the past three decades averages just under 1.01, suggesting that index concentration contributes very little to market volatility.8 The US ratio varies over time, however, and exceeded 1.0 during three notable periods: the mid-1990s, 2005-2017, and around the pandemic in 2020 and 2021. The US ratio was less than 1.0 before and after the internet bubble, and again over the past few years.
The volatility ratio for the MSCI World ex USA Index also varies over time, though it averaged 1.03 and never dropped below 1.0 during the sample period. For the MSCI Emerging Markets Index the ratio fluctuates around 1.0, with a time-series mean of 0.99.
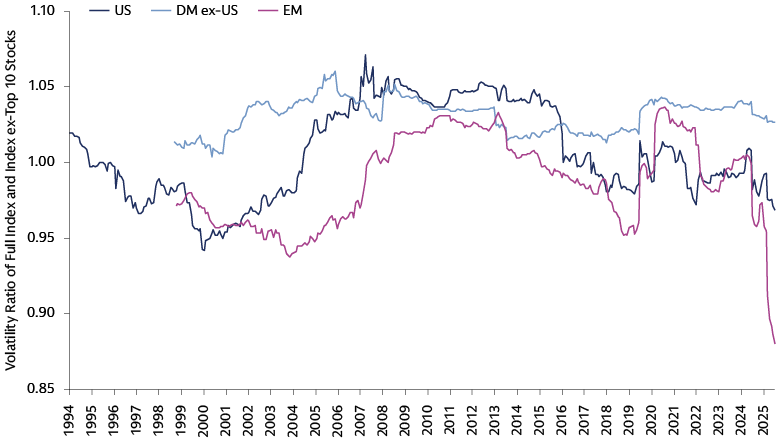
Source: Goldman Sachs Asset Management, S&P Global, MSCI. As of March 2026. Past performance does not predict future returns and does not guarantee future results, which may vary. The chart shows the ratio of the trailing 60-month return volatility of the full index and the trailing 60-month return volatility of the index excluding the stocks of the top 10 companies for the S&P 500, the MSCI World ex-US Index and the MSCI Emerging Markets Index. Monthly frequency over the periods beginning October 1994, June 1999, and July 1999, respectively, and ending March 2026.
Our analysis shows that the link between index concentration and index volatility is not clear-cut. When US index concentration reached historical highs, the volatility of the index including the mega-cap stocks was lower than without them. This means that even when concentration has been the most extreme, the level of index volatility has been largely unaffected. For developed markets outside the US, index volatility when mega-cap stocks are included is higher than without them, though concentration may not be the main driver of this result. After all, concentration of the MSCI World ex-US Index is low compared with its own history and the US and emerging market indices. If concentration were driving volatility, we would expect this to be most visible in the US, but this is not the case.9
The takeaway from this analysis is that investors should not assume that higher index concentration necessarily results in higher short-term price volatility. As we see that top stocks may provide stability even amid peaks in concentration like in recent years, we believe that the return prospects of the concentrated names matter at least as much as the degree of concentration. However, the unclear link between concentration and daily price volatility does not imply that concentration comes without risks. Rather than impacting short-term price fluctuations, we believe the greater risk from a portfolio-management perspective is a heightened sensitivity to sudden, sharp drawdown risks: that a single catalyst, such as a regulatory change, a tech valuation reset, or a sharp rotation could entail large drawdown risks to portfolios overexposed to these stocks concentrated in the same types of business models and thus concurrently affected by similar dynamics.
Elevated Valuations May Not Indicate Mega-Caps Are Overvalued
A second concern raised by investors is that index concentration could indicate that mega-cap stocks are overvalued. If a mega-cap stock has solid fundamentals – the ability to grow earnings – it may have high market capitalization without being overpriced. If elevated market capitalization reflects investor exuberance, however, these stocks could be overpriced.
To examine the potential mispricing of mega-cap stocks, we looked at the relative valuation levels of the top 10 stocks in the indices used in our analysis versus the remaining stocks over time. In the following chart, each line represents the equal-weighted mean of three ratios: the price/earnings, price/book, and price/sales multiples for the top 10 stocks divided by the corresponding multiple for the remaining stocks. The price multiple for a given basket is the equal-weighted harmonic mean of the price multiple across the stocks in the basket.10
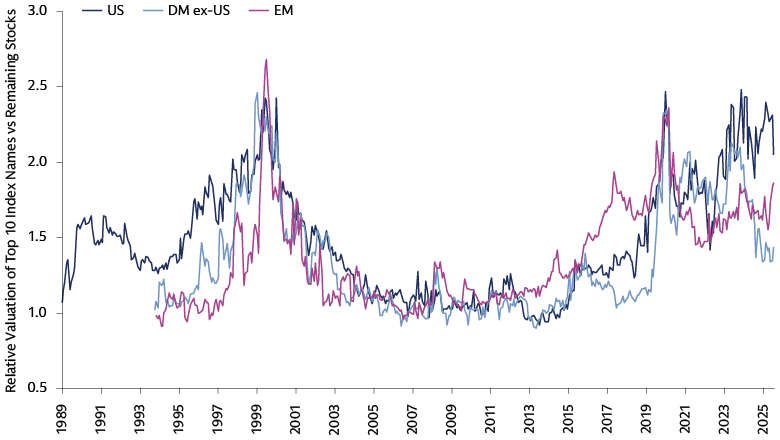
Source: Goldman Sachs Asset Management, S&P Global, MSCI. As of March 2026. Past performance does not predict future returns and does not guarantee future results, which may vary. Relative valuation level of the stocks of the top 10 companies versus the stocks of the remaining companies for the S&P 500 index, the MSCI World ex-US Index and the MSCI Emerging Markets Index. Monthly frequency over the periods beginning November 1989, July 1994, and August 1994, respectively, and ending March 2026.
The relative valuation ratios for the three indices fluctuated dramatically over the sample period, from around 1.0 before and after the global financial crisis to approximately 2.5 at the height of the internet bubble. For the US, the latest relative valuation ratio is also high: 2.05 versus the historical mean of 1.48. This difference suggests that mega-cap US stocks are currently expensive compared with the rest of their US peers.
The differences for the other regions are smaller: 1.43 versus 1.34 for developed markets outside the US, and 1.86 versus 1.38 for emerging markets. While these current relative valuation ratios exceed their historical means, they are well below the levels seen during the internet bubble, suggesting that any current valuation premiums could be justified, in our view.11
The elevated valuation level for US mega-cap stocks does not necessarily mean these stocks are overvalued based on their fundamentals and outlook, but we think it may suggest the US market is highly exposed to any market rotation disfavoring these names, triggered by a sharp shift in investor sentiment or market outlook. To account for this risk and build a more resilient portfolio, we think investors could take steps, including diversifying their equity holdings by allocating to areas where the sensitivity to rotation is less pronounced, such as small-cap companies or developed markets outside the US.
Concentration May Hinder Efficient Management of Long-only Portfolios
Some investors have told us they are concerned about elevated market concentration reducing the efficiency of active equity strategies that are designed to create diversified, long-only portfolios. As the combined weight of mega-cap stocks goes up, the weight of the remaining stocks in the benchmark index goes down. This hampers the ability of long-only strategies to express negative views about non-mega-cap stocks by reducing the potential to underweight these smaller names.
When an index is concentrated, a minority of its constituents have a relatively high index weight relative to the majority. This may create challenges for the managers seeking to offset the impact of overweighting stocks. For example, 50% of the stocks in the MSCI ACWI Index, a proxy for the global equity market, cumulatively account for only 5% of the index.12 Underweighting all these stocks would therefore free up only 5% to apply toward overweight positions elsewhere in the index. In this situation, a manager may need to underweight larger constituents of a concentrated index to express their positive alpha views, especially in a higher-tracking-error strategy that allows bigger bets. Yet with the top 10 stocks accounting for nearly 23% of the index,13 underweighting these stocks because of a structural limitation rather than a negative alpha view may result in the inefficient use of tracking error.
Managing the Impact of Equity Index Concentration
The results of our analysis of index concentration show that its connection with certain market risks, such as volatility or a valuation bubble, is far from straightforward. This does not, however, imply that concentration is without risks that investors should be aware of when managing their portfolios.
A common misconception is that the right approach to address concentration challenges is to go passive on the assumption that this is a lower-risk alternative. The problem is that when a portfolio is highly concentrated and its top holdings are closely related and driven by common risk factors, as in the case of the Magnificent 7, it may expose investors to these concentrated risk factors. This in turn increases the risk that a single catalyst, such as a sharp rotation or change in sentiment could result in a significant drawdown.
While the derivative exposures from benchmark concentration may be beneficial in certain market regimes, passive strategies cannot modify them when market conditions change. During drawdown periods driven by mega-caps, as in 2022, passive investors bore the full brunt of these challenges because of their elevated exposure to these companies. Recent history has shown that reversals may be detrimental to investors’ portfolios, especially when they are not well diversified or dynamic.
At the same time, index concentration may create challenges for active managers of long-only equity portfolios by reducing their efficiency in translating investment views into portfolio weights. Specifically, this may impede the expression of negative views about non-mega-cap stocks by reducing the potential to underweight these smaller names. Hence, with significant concentration risks in the benchmark, we believe investors should remain active, allowing them to plan their allocations, select their managers and implement approaches designed to build resilience and diversification.
From an allocation standpoint, investors may seek to increase exposure to less concentrated market segments, such as small caps and developed markets outside the US. On implementation, investors may seek out managers who may thoughtfully manage the portfolio-construction challenges associated with concentration, where we believe data-driven approaches may be most effective. For example, without major changes to portfolio construction, systematic managers may restrict the aggregate active weight of mega-cap stocks or impose penalties on size exposure to retain the ability to express their negative views.
For investors with the flexibility to modify risk budgets, informational efficiency in long-only portfolios may also be improved systematically in low-tracking-error strategies or extensions. In a low-tracking-error set-up, scaling down the portfolio’s active weights renders the no-shorting constraint less binding. As a result, the impact of a given level of index concentration declines. In an extension strategy that allows short positions, a stock’s benchmark weight does not limit the magnitude of its underweight, allowing managers to express their negative views about small- and mid-cap stocks more fully.
1 “S&P 500 Factsheet,” S&P Dow Jones Indices. As of March 31, 2026.
2 Goldman Sachs Asset Management, S&P Global, MSCI. As of December 31, 2025.
3 “2026 US Equity Outlook: Great Potential,” Goldman Sachs Research. As of January 6, 2026.
4 Goldman Sachs Asset Management, S&P Global, MSCI. As of December 31, 2025.
5 Goldman Sachs Asset Management, Bloomberg, as of March 31, 2026. The Magnificent 7 stocks are Alphabet, Amazon, Apple, Meta Platforms, Microsoft, Nvidia and Tesla.
6 “MSCI Emerging Markets Index Factsheet,” MSCI website. As of March 31, 2026.
7 “MSCI World ex USA Index Factsheet,” MSCI website. As of March 31, 2026.
8 A ratio of 1.01 means that if the volatility of the index without the top 10 stocks is 15%, the volatility with the top 10 stocks would be 15 basis points higher.
9 Goldman Sachs Asset Management, as of December 2025. These examples are for illustrative purposes only and are not actual results. If any assumptions used do not prove to be true, results may vary substantially. There is no guarantee that objectives will be met.
10 The harmonic mean of P/X is equal to the inverse of the cross-sectional mean of X/P (i.e., 1/mean{X/P}).
11 Goldman Sachs Asset Management. As of December 31, 2025. These examples are for illustrative purposes only and are not actual results. If any assumptions used do not prove to be true, results may vary substantially. There is no guarantee that objectives will be met.
12 MSCI and Goldman Sachs Asset Management. As of March 31, 2026.
13 MSCI ACWI Index Factsheet, MSCI. As of March 31, 2026.
