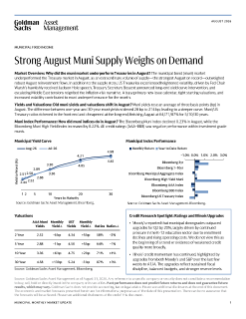
Municipal Fixed Income Monthly August 2026




Key Takeaways
Strong August Muni Supply Weighs on Demand
Market Overview: Why did the muni market underperform Treasuries in August?
The municipal bond (muni) market underperformed the Treasury market in August, as an extraordinary volume of supply—the strongest August on record—outweighed robust August reinvestment flows. In addition to the supply story, US Treasuries experienced heightened volatility, driven by Fed Chair Warsh’s hawkishly received Jackson Hole speech, Treasury Secretary Bessent announced long-end yield curve intervention, and escalating Middle East tensions reignited the inflation-risk narrative. A busy primary new issue calendar, tight starting valuations, and increased volatility contributed to muni underperformance for the month.
Yields and Valuations: Did muni yields and valuations shift in August?
Muni yields rose an average of three basis points (bp) in August. The difference between one-year and 30-year muni yields widened 20 bp to 214 bp, leading to a steeper curve. Muni/US Treasury ratios richened in the front end and cheapened at the long end, finishing August at 64/71/87% for 5/10/30 years.
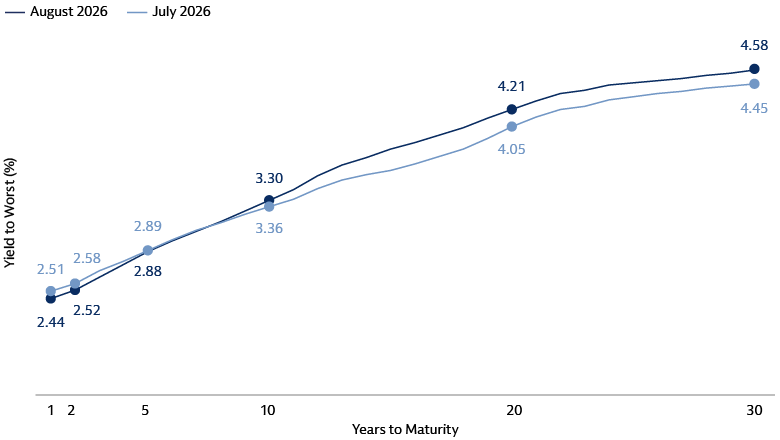
Source: Goldman Sachs Asset Management. Bloomberg. As of August 31, 2026.
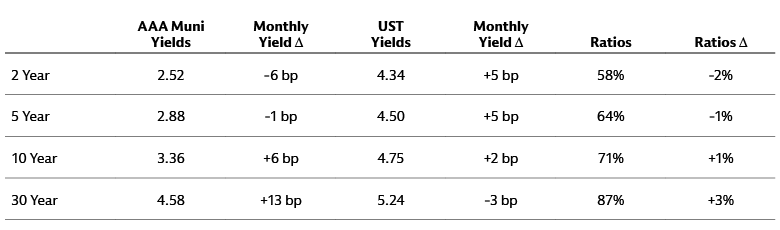
Source: Goldman Sachs Asset Management. Bloomberg. As of August 31, 2026.
Muni Index Performance: How did muni indices do in August?
The Bloomberg Muni Index declined 0.23% in August, while the Bloomberg Muni High Yield Index increased by 0.22%. All credit ratings (AAA–BBB) saw negative performance within investment grade munis.
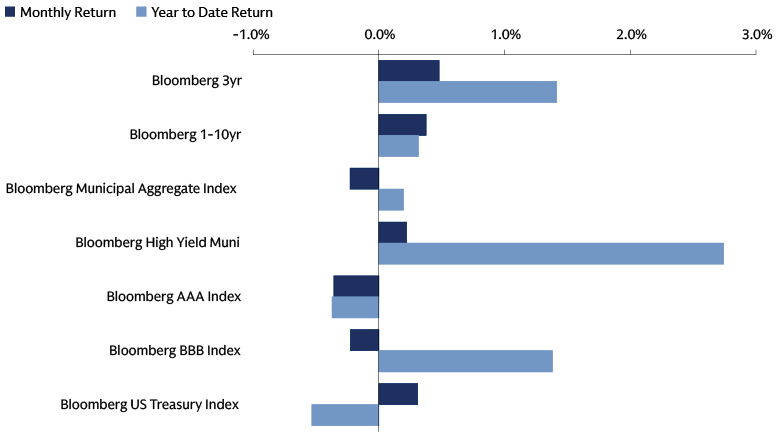
Source: Goldman Sachs Asset Management. Bloomberg. As of August 31, 2026.
Credit Research Spotlight: Ratings and Illinois Upgrades
- Moody's reported that municipal downgrades outpaced upgrades for Q2 by 20%, largely driven by continued pressure in the K-12 education sector due to enrollment declines and rising operating costs. We do not view this as the beginning of a trend or evidence of weakened credit quality more broadly.
- Illinois’ credit momentum has continued, highlighted by upgrades from both Moody’s and S&P over the last few weeks to A1/A. The upgrades reflect sustained fiscal discipline, balanced budgets, and stronger reserve levels.
Muni Musings: What is the outlook for the muni market?

Supply for the rest of the year should remain elevated given continued infrastructure needs and refinancing activity. We expect reinvestment demand to taper off in the fall, but anticipate new money flows to continue given attractive yield entry points.

Muni/US Treasury ratios remain near fair value and credit spreads are close to their five-year historical averages. We see the opportunity to lock in attractive absolute yields during the recent interest rate volatility.

We anticipate headline-driven volatility to remain present, but a resilient underlying economy and healthy reserve balances continue to put municipalities in a strong position to navigate the path forward.
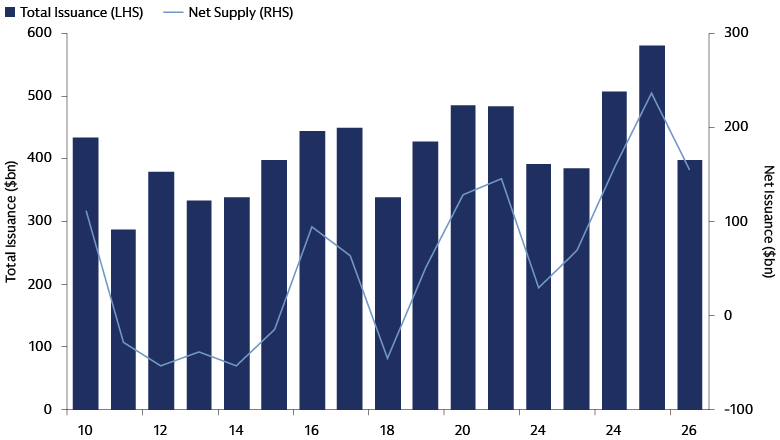
Supply: Strong monthly supply
August new issue supply amounted to $59 billion ($56 billion tax-exempt and $3 billion taxable). This was 17% higher than August 2025 volumes and 31% higher than July. Year-to-date, new issue volumes are 2% higher than this time last year.
Weekly new issuance volumes in August ranged from $12 billion to $19 billion. Notable deals included $3.1 billion in California GO bonds, $2.7 billion in revenue bonds for Los Angeles International Airport, and $1.5 billion NYC GO bonds.
Source: Goldman Sachs Asset Management. The Bond Buyer, Barclays. As of August 31, 2026.
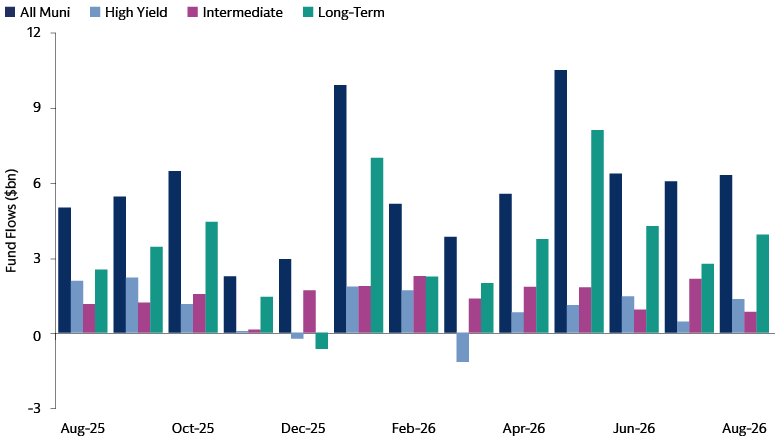
Demand: Positive momentum
August saw positive inflows for all four weeks, totaling $6.3 billion. The strongest demand was during the first and last weeks of the month, posting $1.3 billion and $1.4 billion in inflows, respectively. On average, each week had $1 billion worth of inflows based on weekly reporters' data.
Overall, August experienced robust demand across both investment grade and long-duration munis. Year-to-date fund inflows have totaled $69 billion, with the majority of flows into investment grade and long duration munis.
Source: Goldman Sachs Asset Management. Refinitiv. As of August 31, 2026.
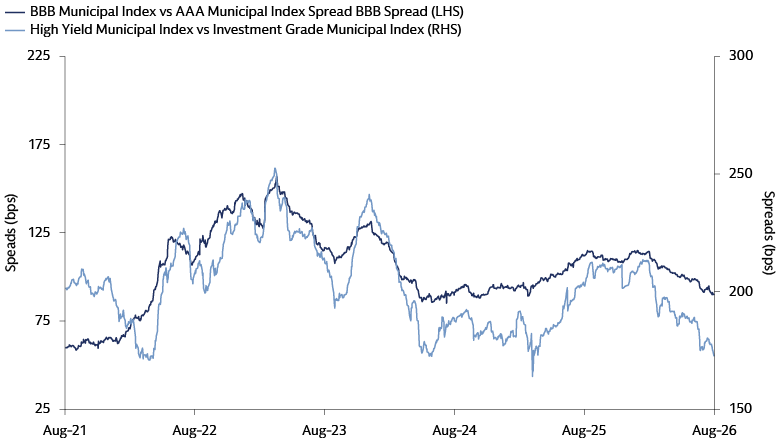
Spreads: Continued tightening in August
Investment grade and high yield spreads both tightened by 2 bp, finishing August at 85 bp and 169 bp, respectively.
Within high yield, the transportation and hospital sectors had the strongest performance, returning 1.02% and 0.63%. GO and airline showed the largest negative returns, down 0.32% and 0.21%, respectively.
Source: Goldman Sachs Asset Management, Bloomberg. As of August 31, 2026.