Municipal Market Review 2Q 2026

Strong Technicals Drive Positive Quarter for Munis
Market Overview: How did munis fare in 2Q?
Municipal bond (muni) yields rallied during the second quarter of 2026, supported by robust demand and summer reinvestment capital. US Treasury yields rose as the market began pricing in potential rate hikes. Persistent interest rate volatility over the quarter was largely fueled by the ongoing Iran conflict, which shifted the market narrative back toward inflation. In response, the Federal Reserve held the federal funds rate at 3.50-3.75%. Strong technicals drove muni outperformance throughout the quarter; despite elevated new-issue supply, summer reinvestment flows and solid demand anchored muni yields even as Treasuries repriced on rising inflation expectations.
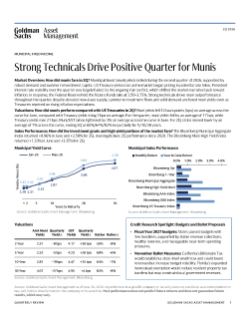
Valuations: How did munis perform compared with US Treasuries in 2Q?
Muni yields fell 12 basis points (bps) on average across the curve for June, compared with Treasury yields rising 7 bps on average. For the quarter, muni yields fell by an average of 17 bps, while Treasury yields rose 21 bps. Muni/UST ratios tightened by 3% on average across the curve in June. For 2Q, ratios moved lower by an average of 7% across the curve, ending 2Q at 60%/64%/82% respectively for 5/10/30 years.
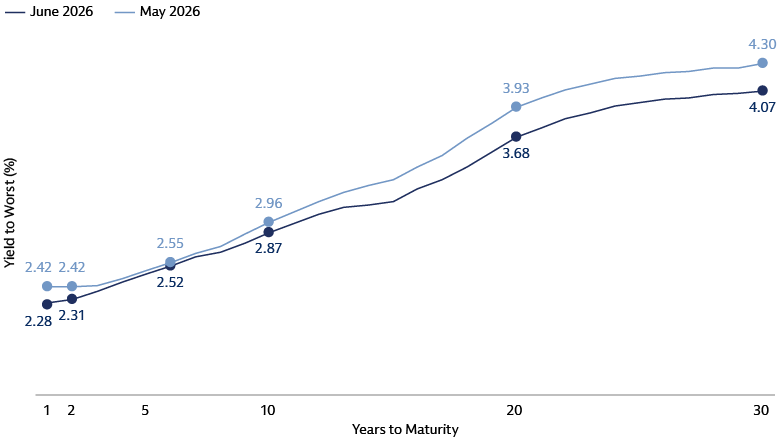
Source: Goldman Sachs Asset Management. Bloomberg. As of June 30, 2026.
Source: Goldman Sachs Asset Management. Bloomberg. As of June 30, 2026.
Index Performance: How did the investment grade and high yield portions of the market fare?
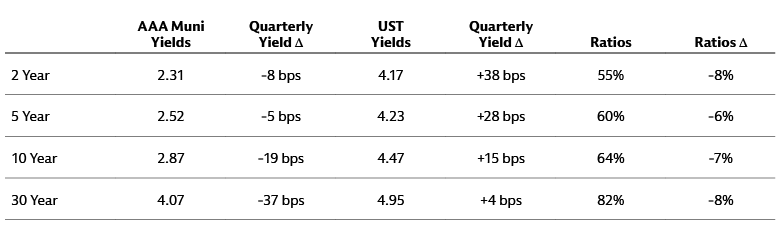
The Bloomberg Municipal Aggregate Index returned +0.96% in June and +2.50% for 2Q, marking its best 2Q performance since 2020. The Bloomberg Muni High Yield Index returned +1.33% in June and +3.35% for 2Q.
Source: Goldman Sachs Asset Management. Bloomberg. As of June 30, 2026.
Credit Research Spotlight: Budgets and Ballot Proposals
Fiscal Year 2027 budgets: States passed budgets with few headlines, supported by stable revenue collections, healthy reserves, and manageable near-term spending pressures.
November Ballot Measures: California’s Billionaire Tax would establish a state-level wealth tax and could boost revenues but increase budget volatility. Florida’s expanded homestead exemption would reduce resident property tax burdens but may constrain local government revenues.
Muni Musings: How can investors capitalize on persistent demand and attractive absolute yields in 2H?
Third-quarter supply should remain elevated given continued infrastructure needs. We expect demand to persist given the steepness of the curve relative to Treasuries and attractive yields providing compelling entry points.
Ratios are rich relative to Treasuries and spreads are at their five-year averages. Investors may find opportunities to lock in attractive absolute yields as we anticipate rate volatility to persist.
We anticipate headline-driven volatility to remain present, but healthy reserve balances and a resilient underlying economy continue to put municipalities in a strong position to navigate any news-driven headwinds.
Supply: Robust June supply drove 2Q muni issuance
June new issue supply amounted to $61 billion ($58 billion tax-exempt and $3 billion taxable), the highest June monthly supply on record. This was an increase of 14% from May, and 3% higher versus June 2025. Weekly new issuance volumes in June ranged from $5 billion to $21 billion.
For the second quarter, municipal issuance totaled $166 billion ($154 billion tax-exempt and $12 billion taxable). This was 25% above the previous quarter and 2% higher than the second quarter of 2025.
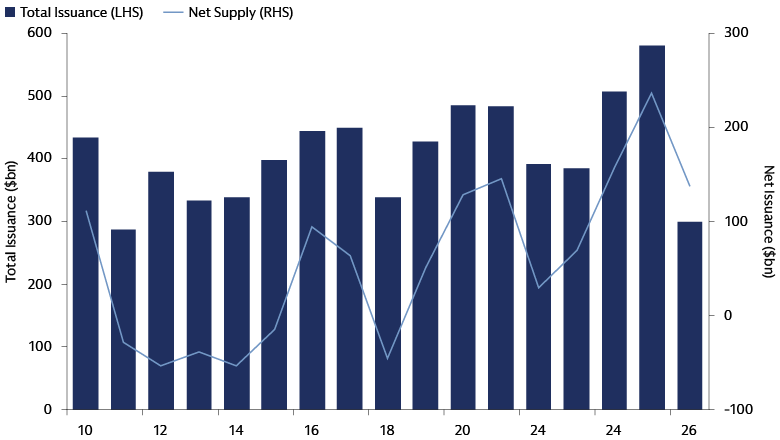
Source: Goldman Sachs Asset Management. The Bond Buyer, Barclays. As of June 30, 2026
Demand: Positive inflows marked near record 1H pace
Munis saw positive inflows across credit quality and duration ranges through June, with an average of $965 million of inflows each week. Inflows continued to trend towards investment grade and long-term munis.
Muni fund flows totaled $6.3 billion for June. Year-to-date flows totaled $53 billion ($27 billion mutual funds and $26 billion ETFs), the second-fastest pace for the first half of a year. Investment grade quality munis saw strong flows at the intermediate and long-end of the curve.
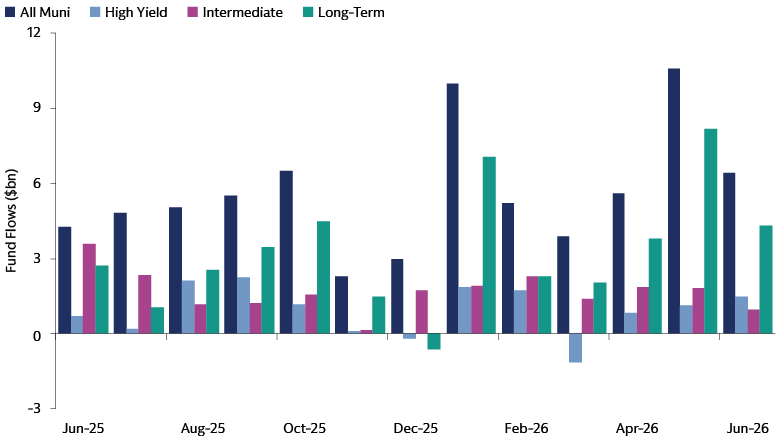
Source: Goldman Sachs Asset Management. Refinitiv. As of June 30, 2026
Spreads: Tightening in 2Q
Spreads in BBB and high yield munis tightened 1 bp and 2 bps, respectively, in June, ending the month at 94 bps and 183 bps. For the second quarter, BBB and high yield spreads both tightened by 6 bps.
Tobacco was the only negatively performing high yield sector in the second quarter, returning -0.84%. All high yield maturity cohorts posted positive returns, with stronger returns in longer dated maturities. Specifically for June within high yield, the long maturity and education sector were the top performers, at +1.81% and +2.24%, respectively.
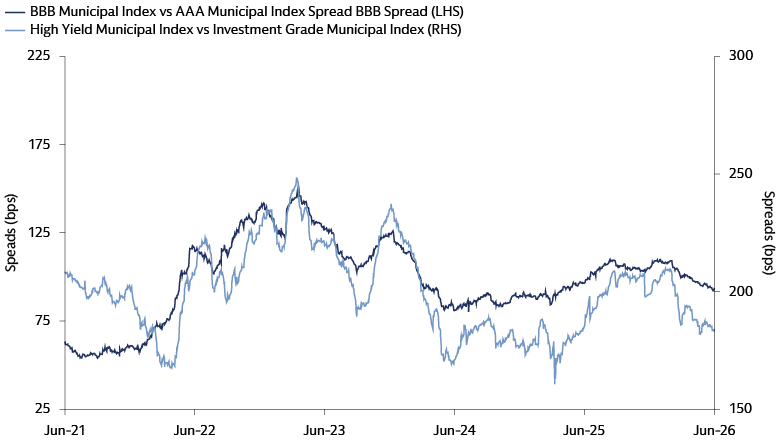
Source: Goldman Sachs Asset Management, Bloomberg. As of June 30, 2026