Active ETFs: Helping Bolster Portfolio Resilience in Uncertain Markets

Key Takeaways
In turbulent markets, active management matters. With heightened uncertainty around international trade, economic growth and inflation, maintaining a long-term perspective is crucial in this year’s fast-moving environment. Active strategies can help investors stay invested by building a diversified portfolio designed to manage risks and capture potential opportunities in volatile markets.
For years, investors seeking the in-depth research and alpha potential that professional asset management can provide typically turned to mutual funds. More recently, actively managed exchanged-traded funds have expanded investors’ options. Active ETFs have been growing fast, topping $1.1 trillion in assets under management globally.1 The market is dominated by the US, though the popularity of active ETFs in Europe has been growing rapidly, with assets increasing to the equivalent of about $60 billion.2
The solutions offered by active ETFs cover the spectrum of active approaches. At one end, enhanced-indexing products blend active and passive strategies to help investors pursue more stable alpha in their core equity holdings. At the other end of the spectrum, more aggressive active strategies take additional risk with the goal of significantly outperforming a benchmark. Specialized equity funds can offer consistent income or downside protection. In fixed income, active ETFs can provide access to markets such as corporate and municipal bonds where we believe structural inefficiencies make rigorous bottom-up security selection essential.
In addition to the potential benefits of active management, active ETFs offer the advantages common to all exchange-traded funds. They can be bought and sold on an exchange at a known price, just like stocks. They can be cost-effective and provide increased transparency on holdings. By bringing together active management and the ETF vehicle, active ETFs may complement investors’ existing allocations to diversify their portfolios and potentially strengthen their resilience in periods of market uncertainty.
Enhancing Core Alpha Stability
In constructing a core-and-satellite portfolio, many investors rely on passive strategies for their core allocation thanks to their cost-efficiency and greater predictability. Yet index-tracking strategies offer scant opportunity to generate excess returns, manage risk or adjust to changing market conditions. For this reason, we think passive exposures may not be the most efficient use of portfolio risk budget. Enhanced equity strategies can complement core strategies by offering a middle ground between passive and active investing. Like passive strategies, enhanced equity funds limit tracking error by hewing close to a reference benchmark; like active strategies, they offer professional risk management and the potential to outperform the market.
Enhanced strategies are designed to create the potential for outperformance through investments that deviate from the benchmark while keeping risk within acceptable limits. They do this by setting a target for permissible tracking error that varies by product, but tends to fall in a range of 100 to 200 basis points. This added risk gives active managers scope to improve risk-adjusted returns by overweighting or underweighting stocks based on forward-looking views. These active positions tend to be distributed across market caps, sectors and geographies to limit concentration and maintain a composition that is close to the benchmark.
Enhanced strategies have the potential not just to outperform their benchmark, but also to deliver positive performance more frequently, though at smaller magnitudes, than higher-tracking-error strategies. The potential for greater alpha stability is paired with alpha efficiency. As deviation from the benchmark increases, so does the potential for excess returns. This does not happen in a linear fashion, however. As tracking error increases, we see a decreasing marginal return to alpha. In other words, the potential for risk-adjusted outperformance tends to be highest at lower levels of tracking error. This allows enhanced strategies with limited tracking error to potentially generate more consistent alpha, as shown in the following chart.
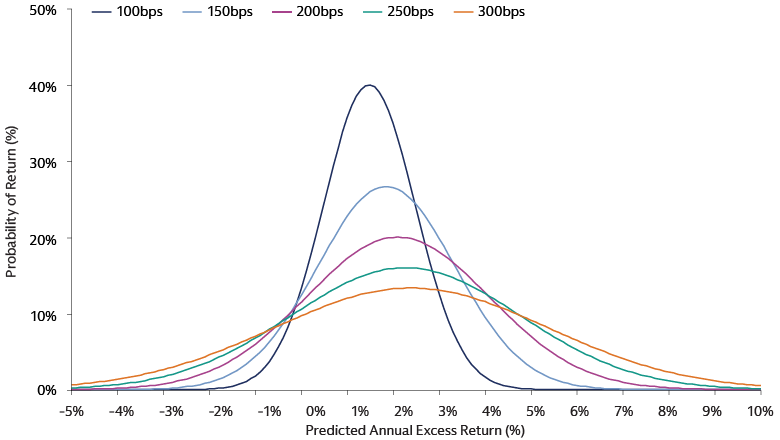
Source: Goldman Sachs Asset Management. For illustrative purposes only. The illustration shows the probability of a portfolio to achieve various levels of annual excess returns for various levels of tracking error. For instance, while a portfolio with 100 bps of tracking error (in dark blue) may have an average predicted annual excess return that is lower than one with 200 bps of tracking error (in purple)–seen in the horizontal midpoint of each respective bell curve, the probability of achieving that return is higher for the 100 bps portfolio–seen in the vertical height of each bell curve. A lower tracking error portfolio encompasses a much higher certainty of controlled positive return. The illustration is not related to any Goldman Sachs Asset Management product or strategy.
In our view, this potential alpha stability strengthens the investment case for enhanced equity strategies in periods of elevated market uncertainty. Providing access to these strategies in an active ETF vehicle offers investors a nimble tool to navigate unstable markets with the added benefits of cost-efficient access, enhanced transparency and the flexibility of intraday trading.
Agile Access to Inefficient Markets
Periods of heightened market stress can potentially create an attractive environment for stock-pickers. The case for actively managed equity strategies is especially strong in less efficient markets, such as in US small caps and emerging markets. Both can provide a good source of portfolio diversification and the potential for professional managers to outperform.
The case for investing in US small caps is based on their attractive valuations3 coupled with their expected earnings growth.4 Small caps can also help investors diversify away from concentration risks in the main US large-cap indices.5 In addition, smaller companies tend to be more domestically focused, with US small caps deriving only 23% of their revenue from outside the US compared with about 40% for S&P 500 companies.6 As a result, they may face less severe tariff headwinds.
We believe that an active investment approach is best suited to the small-cap market, primarily because of its relative inefficiency. A key reason for this inefficiency is the limited coverage by sell-side analysts,7 which reduces the amount of readily available information and creates the potential for diligent stock-pickers to generate significant alpha. The weight of unprofitable companies in the small cap market–more than a quarter of the Russell 2000 index, compared with just 4% of the S&P 5008–and the variability in stock price performance also underscore the importance of rigorous research and careful stock selection.
Even greater inefficiencies can exist in emerging markets, making them ripe for potential alpha generation by active stock-pickers. For example, India–the second largest emerging market behind China and one of the few major economies projected to see great than 6% annual real GDP growth over the next few years9–has a large and diverse equity market. Indian stocks, however, significantly less well covered than their US counterparts, resulting in meaningful informational inefficiencies. These can be exploited by active stock-pickers with experience in the local market.
In emerging markets like India, the most compelling potential opportunities can often be found beyond the benchmark, including in mid-caps, small-caps, and initial public offerings (IPOs). These names are often missed by passive strategies. Conversely, index-tracking strategies may provide too much exposure to state-owned enterprises, which can feature prominently in emerging market benchmarks but may not offer compelling returns on investment as government influence can negatively impact minority shareholder returns. An active approach can be selective about which names to own and can also take advantage of opportunities beyond the benchmark.
Active ETFs allow investors to gain exposure to inefficient markets such as US small caps and emerging market equities, benefitting from the experience and expertise of professional fund managers and the potential for generating alpha. The vehicles combine this active engine with the flexibility of intraday trading and enhanced transparency on holdings, providing investors with the information they need to assess their investments and the agility to act on it.
Increasing Predictability Amid Volatility
The start of 2025 saw a surge of interest in US-domiciled options-based ETFs from investors who want to remain invested in equities while seeking greater predictability in whipsawing markets. Derivative-income ETFs, which are designed to generate income from a portfolio of assets with the use of options contracts, took in a record $15.7 billion in net new money in the first quarter, rising to $26.5 billion at the end of May.10 Defined-outcome ETFs, which seek to provide a measure of protection against market losses in exchange for a cap on gains, pulled in $4.4 billion in the first quarter–also a record–rising to $6.3 billion at the end of May.11
Derivative-income ETFs, also known as covered-call or buy-write strategies, seek to provide an additional source of potential return in the form of distributions, which can be especially valuable in periods of market volatility. They offer an alternative to fixed income by providing a source of yield that is not tied to interest rates. They typically do this by holding a diversified basket of securities and selling call options against it, which partially limits exposure to market gains but provides income from both dividends and option premiums. Distributions from these funds may help cushion underperformance during market downturns. As a result, derivative-income strategies tend to produce higher lows and lower highs.
By actively managing the call option overlay strategy, a manager can also adapt to a changing market environment by dynamically adjusting the options coverage ratio. When volatility rises and options typically become more expensive, less of the portfolio needs to be “covered” to generate the same level of income. This leaves the “uncovered” portion of the portfolio exposed to market movements and can help the portfolio capture more upside if markets rebound.
Defined-outcome or buffer ETFs also make use of an actively managed options strategy, but with a different objective: They seek to deliver an outcome within a pre-defined range over a set period, providing investors with an equity-based hedge against portfolio volatility that can complement other defensive strategies. They do this by installing a put spread to create a downside buffer, while a call option determines the upside cap–the maximum gain the fund can earn over the full outcome period in exchange for the downside protection.
Options are bought and sold at the beginning of each outcome period, so shorter outcome periods allow active managers more frequent resets. In volatile markets, when options are typically more expensive, a higher cap can often be achieved by selling a call option that is farther out of the money. By protecting investors against market drawdowns yet also allowing them to participate in price gains up to this cap, buffer ETFs help mitigate the risk of selling the dip and missing out on a potential rebound in equity markets. We think defined-outcome strategies can add resilience and diversification to a portfolio in periods of market uncertainty.
Strengthening Total Return Potential
Investors have long viewed fixed income as a potential source of income and returns during equity-market downturns. Despite the elevated volatility fueled by US economic and policy uncertainty, we think investment-grade (IG) credit can continue to perform this role, with greater resilience than riskier asset classes such as US high-yield debt and equities. In our view, today’s elevated IG credit yields12 may offer an attractive opportunity to investors.
The starting point for IG corporate credit fundamentals in the tariff shock was strong. As a result, we expect total returns to remain resilient compared with other risk assets. Yield is a key driver of long-term total return, and all-in yield for IG corporate bonds remains historically attractive. Credit spreads are narrow relative to their historical range. This reflects generally healthy credit fundamentals, though it merits robust security selection, which active investment management can provide.
Uncertainty around trade policy is likely to continue creating performance differences between companies based on tariff sensitivity in the second half of the year. Combined with increased market volatility, this could create dislocations and attractive risk premiums that active managers can capture through rigorous bottom-up security selection. As policy changes and the shape and slope of the yield curve shifts, an active approach could help investors optimize yield-curve positioning to deliver the most attractive risk-reward. We find value in the short-to-intermediate parts of the credit curve that reflect attractive carry and roll-down relative to recent history. Moreover, the scope and breadth of the global IG corporate credit market provides investors with options for diversification across sectors and geographies, potentially bolstering the resilience of their portfolios. Active ETFs are a flexible way to gain exposure to IG credit, with the potential for outperformance and enhanced transparency on holdings.
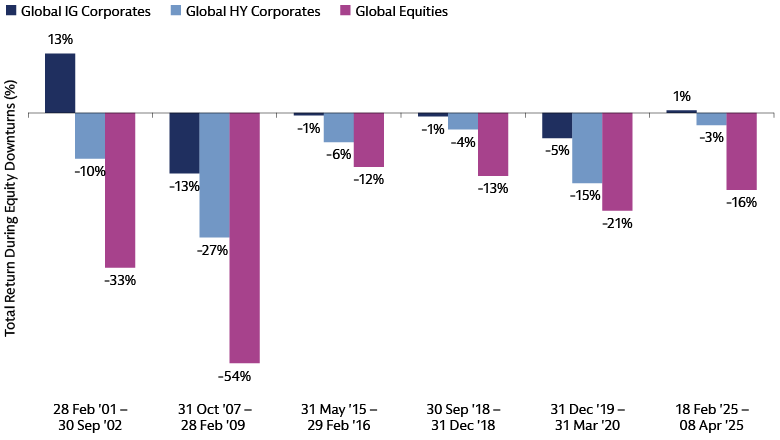
Source: Bloomberg. As of April 2025. Equity downturn periods defined by a 10% decline in the MSCI World Index. “Global IG Corporates” refers to the Bloomberg Global Aggregate Corporate Index; “Global HY Corporates” refers to the Bloomberg Global High Yield Index. Past performance does not predict future returns and does not guarantee future results, which may vary.
Generating Regular, Tax-efficient Income
Elsewhere in fixed income, we continue to see attractive income potential and strong primary market supply within the US municipal-bond market. Municipal bonds–or munis for short–are issued by states, cities and other government entities to finance public projects and services including schools and roads. They can offer three main benefits to investors:
- Interest income generated by most municipal bonds is generally exempt from federal income tax. Municipal bonds also tend to be exempt from state tax for buyers who reside in the state of issuance, whereas the tax treatment can vary for buyers who reside elsewhere.
- Munis aim to provide a steady stream of interest payments, so can be attractive to investors seeking regular income.
- Munis can contribute to portfolio diversification and help reduce volatility because their returns are often less correlated with equities.
Investors considering an allocation to munis should keep in mind that the market is highly fragmented and often less transparent than the corporate bond market, for example. For these reasons, we think it is important to adopt an active approach and rigorous security selection, allowing portfolio managers to capitalize on market inefficiencies, employ tax-loss harvesting strategies, and seek to capitalize on opportunities across the yield curve and credit spectrum.
Active ETFs are an increasingly popular vehicle for gaining exposure to municipal bonds, combining active management to navigate the risks and structural inefficiencies of this market with the transparency and ease of trading that come with the ETF wrapper. These benefits have helped drive investor interest in these strategies, with $5.5 billion of inflows in the first five months of this year. Total net assets in active ETFs providing exposure to munis stands at $29.8 billion, up from $23 billion at the end of last year.13
Time to Get Active
In this rapidly evolving environment, with elevated economic and policy uncertainty, we think it is crucial to stay focused on the fundamentals. The tariff shock indicates rising dispersion, underscoring the importance of portfolio diversification, exacting bottom-up security selection, and a dynamic approach to potentially capitalize on upside opportunities. Active ETFs, which combine the research and rigor of active management with the flexibility and transparency of the ETF wrapper, offer investors a range of potential solutions to help navigate market turbulence.
1 Morningstar. As of April 30, 2025.
2 “Europe Open-End and ETF Flows Q1 2025,” Morningstar. Data as of March 31, 2025. The dollar figure given here was converted from the original figure–€55 billion–at the exchange rate as of March 31, 2025.
3 Furey Research Partners and FactSet. As of March 31, 2025. Excluding unprofitable companies, US small caps are trading at a 29% discount to US large caps, well below the historical average discount of 3%.
4 FactSet, Goldman Sachs Asset Management. As of May 31, 2025. For 2025, the one-year consensus estimate of earnings growth for the Russell 2000 index is 36.1%, compared with 8.8% for the S&P 500. For 2026, the one-year consensus estimate of earnings growth is 36.4% for the Russell 2000 and 13.4% for the S&P 500.
5 The Russell 2000 index of US small-cap stocks, for example, has only 4% of its value concentrated in its top 10 holdings, compared with 35% in the S&P 500. See: Goldman Sachs Asset Management, FactSet. As of March 31, 2025.
6 FactSet. As of March 31, 2025.
7 Furey Research Partners. As of March 31, 2025. Average sell-side analyst coverage is six analysts per company in the Russell 2000 Index vs. 20 analysts per company in the S&P 500 Index.
8 FactSet. As of March 31, 2025.
9 “Indian equities: Local headwinds stabilizing, Global risks remain,” Goldman Sachs Global Investment Research. As of March 7, 2025.
10 Morningstar. As of May 31, 2025. Ex funds of funds and feeder funds.
11 Morningstar. As of May 31, 2025. Ex funds of funds and feeder funds.
12 Goldman Sachs Asset Management. As of April 24, 2025. Global IG corporate credit yields, which currently exceed 4.5%, have only been higher 15% of the time over the past 15 years.
13 Morningstar. As of May 31, 2025.
