Embracing a Broader Equity Landscape

Key Takeaways
We believe equity market opportunities are broadening beyond US mega-cap dominance—a theme we highlighted in our 2025 Outlook. Here, we build on our base case by exploring opportunities for investors to go down the market cap spectrum, go out in developed and emerging markets, and go deep into differentiated long-term themes. We believe an active investment approach, diversification and solid risk management will be essential as a wider set of opportunities emerge.
Signs of a Shift in Market Leadership
Recent risk-off episodes, including January’s US tech selloff spurred by DeepSeek and volatility in March, highlight the perils of market concentration and the importance of diversification. We have already observed a remarkable degree of dispersion within the US market in 2025, with the spread between the realized volatility of the average S&P 500 constituent and the realized volatility of the S&P 500 Index hitting the widest point since November 2020. Policy uncertainty, particularly around tariffs, is adding to an unpredictable environment.
While we have a robust outlook for technology in 2025, we believe the extremely narrow leadership of large US technology names that has dominated the past decade is coming to an end. Capital allocation away from the Magnificent 7 has begun and we believe many of the market leaders are unlikely to remain at the top. This may signal the start of a prime period for stock pickers as new opportunities emerge across the market cap spectrum, as well as regionally and thematically.
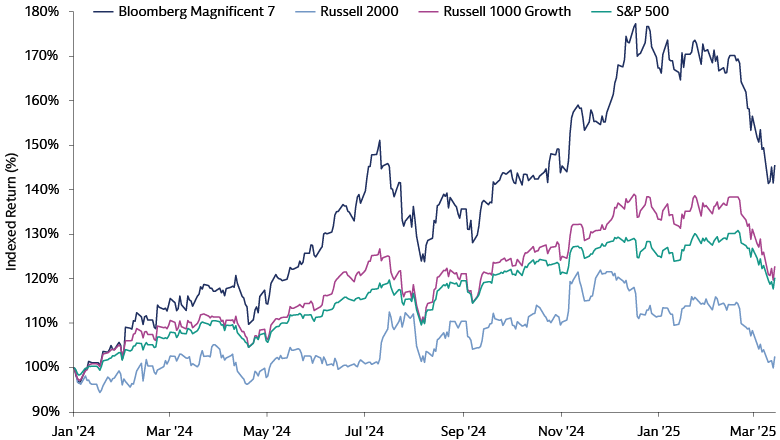
Source: Bloomberg. As of March 19, 2025. The Bloomberg Magnificent 7 Total Return Index is an equal-dollar weighted equity benchmark consisting of a fixed basket of 7 widely-traded companies (Microsoft, Amazon, Meta, Apple, Google parent Alphabet, Nvidia, and Tesla) classified in the United States and representing the Communications, Consumer Discretionary and Technology sectors as defined by Bloomberg Industry Classification System (BICS). Past performance does not predict future returns and does not guarantee future results, which may vary. Any reference to a specific company or security does not constitute a recommendation to buy, sell, hold or directly invest in the company or its securities.
Going Down the Market Cap Spectrum
Small Caps
Small caps present an opportunity for investors to leverage the strength of the US economy while diversifying away from still highly concentrated parts of the market. Trade tensions potentially heighten the appeal of more domestically focused business models.
In addition, we believe 2025 looks particularly favorable for the asset class based on historical patterns. The median profitable company in the Russell 2000 Index still trades at a deep discount relative to large cap counterparts. The index has also delivered positive returns 100% of the time following the last 11 presidential elections, with an average return of 17.6%.1 Meanwhile, a positive IPO outlook supports the small cap asset class, with 9 out of 10 M&A targets being small caps.2 US small caps’ forward one-year returns at the start of the last three M&A cycles (that started in March 1992, November 2002 and February 2010), were 13%, 35% and 31% respectively.3 In the year following the end of each of the last five rate cutting cycles, small caps have on average returned 45% compared to 33% for large caps.4 Given the potential for a strong earnings growth rebound (consensus estimates suggest a 43% earnings growth rate for the Russell 2000 in 2025, compared to 11% for the S&P 500),5 we believe that current valuations offer an attractive entry point into the asset class.6
Going Out in Developed Markets
Japan
Corporate earnings in Japan have outpaced most global markets recently and we expect this trend to continue in 2025. After reaching an all-time high in July 2024 and having finished the year at the highest year-end closing price since 1989,7 the TOPIX is expected to return 8% in 2025, driven by 8% annual EPS growth.8 Record share buybacks contributed to the gains. We see potential upside from Japan’s corporate governance reforms, which we expect to unlock shareholder returns and attract non-Japanese investors. Valuations are still close to long-term averages, in our view, leaving room for more upside as investor momentum potentially picks up.
Over the coming quarters we may see new equity market momentum emerge from factors like consumption and investment inflows. Wage growth may improve domestic purchasing power. Corporate governance reforms and a move towards inflation are likely to support markets in the shape of buybacks and domestic investments. Signs of sustainable inflation suggest the Bank of Japan will continue to raise rates in 2025. As concerns about a rapidly appreciating yen dissipate, earnings growth will likely drive returns for Japanese markets. Forecasts suggest a cumulative EPS growth of 30% for FY24-FY26 is possible.9 Japan continues to trade at a level close to the long-term average.10
Europe
European equities rallied at the start of 2025, but a sustained recovery requires improved investor sentiment. Potential catalysts include a resolution to the Ukraine conflict and clarity around US trade policy. Fiscal and monetary policy interventions may boost growth and market stability. A manufacturing sector rebound would signal economic stabilization, while skepticism around US mega-cap tech valuations could shift focus to undervalued European equities. The European Central Bank’s rate-cutting cycle may weaken the euro, benefiting Europe’s exporters, who make up a significant part of the stock market. The STOXX Europe 600 derives 25% of its revenue from the US.11 Cyclical sectors like original equipment manufacturers, transportation, retailing, and energy could benefit from macroeconomic improvements. Finding European companies that can provide sustainable long-term dividend payments is also an approach that may be particularly prudent in the current macro environment.
The impressive performance of Germany’s DAX Index in 2024—despite a barely growing German economy—highlights that macroeconomic performance does not always equal market performance. And even if the market struggles, many financially strong and globally competitive European companies can still do well. We see potential opportunities for active stock pickers in areas like luxury, specialty chemicals, and medical equipment, balanced by defensive sectors like utilities. European stocks trade in line with their history but at a significant discount to the US, which is not justified, in our view, given strong earnings. The five-year realized EPS growth performance in Europe has moved closer to that of the US.
Going Out in Emerging Markets
Emerging markets have underperformed developed markets in recent years, and investor sentiment towards the asset class has been muted. In 2024, the MSCI Emerging Market Equity Index posted a return of +7.5% in 2024, significantly underperforming the S&P 500’s +23.3% gain.12 Emerging market equity valuations still trade at the biggest discount to the S&P 500 since 2012 on a forward price-earnings-basis. However, with elevated GDP growth, forecast earnings growth and low valuations across emerging markets, we think there may be overlooked equity opportunities for investors to uncover in 2025.
At a macro level, US interest rates tend to be influential on EM performance. If the Fed cuts further, we expect this to provide additional headroom for EM central banks to also lower rates, potentially boosting equities. Conversely, any increase in inflation expectation in the US and in developed markets, could be a headwind for emerging market stocks. In terms of the trade policy and supply chain diversification, whilst we think some degree of tariff expectation is already priced into markets, any major move in US trade policy under the Trump administration could impact emerging markets.
When considering the impact of tariffs, we think there are two important considerations. The first relates to the nature of tariffs. The impacts of across-the-board blanket tariffs or selective tariffs focusing on individual countries companies are likely to vary significantly. The former may change supply dynamics overall. Whilst we do not attempt to anticipate the US trade policy, we do see some opportunities in supply chain diversification as companies look to reduce single country supply chain exposure by investing in production facilities in new locations. The second revolves around the export orientation of economies and business. When assessing the impact of tariffs, it is important to consider the import/export orientation of those economies and companies. 74% of the revenue exposure of MSCI EM Index constituents sits within EM countries, which means that while tariffs are likely to be impactful, domestic demand provides a significant alternative market for many EM companies.13
On the ground, domestic consumers in emerging markets make different spending choices, with an increasing focus on convenience and luxury. As working populations in developing economies grow, and continue to spend and invest, companies are adapting to meet their demands. We believe this is a long-term trend which will play out in 2025 and beyond.
India
We believe India is not only relatively resilient to global macro and geopolitical developments, but potentially a beneficiary of today’s evolving landscape. Our India investor tour reinforced our long-term views on the strength of the country’s economy. In our view, a recent equity market correction—triggered by a mid-cycle slowdown in earnings, urban consumption, and public capex— offers an attractive entry point for long term investors.
India remains one of the best compounding markets in the EM universe. Over the past decade, MSCI India has delivered 9.5% p.a. in USD terms, almost 3x higher than MSCI Emerging Markets Index that returned 3.6%.14 The country’s long-term structural growth story remains intact with expectations of real GDP growth at ~6.5% and continued consolidation in deficits with a declining trend in inflation.15 MSCI India earnings are expected to grow at mid-double digits in CY25-26 providing support to equities in the medium term.16
At a geopolitical level, India has shown pragmatic diplomacy by attempting to foster relationships with major economies while maintaining its strategic autonomy. While the timing and specifics of trade policy changes of the new US administration remain unclear, resilient external balances, low exposure to the US in terms of product exports and geopolitical neutrality may provide India with a strong economic moat against proposed higher tariffs. The Indian government’s continued push towards manufacturing along with cost effective factors of production also make India a strategic partner for “secure sourcing” of components for President Trump’s “America First” policy.
China
Chinese equity volatility has continued into 2025, driven by ongoing US-China tensions, and uncertainty surrounding potential tariff actions from the new US administration. Chinese companies have posted 13 consecutive quarters of earnings misses since 2021. This trend may persist through the first half of 2025, but we believe certain selective segments of the market stand out, demonstrating resilience and re-rating potential.
Consumer businesses, including home appliances, are poised to benefit in 2025 as policymakers focus on boosting domestic demand. The automotive industry is likely to remain resilient, driven by government subsidies, robust electric vehicle demand, stabilizing margins, and continued global market share gains, despite higher US tariffs. Semiconductors, hardware, and software companies may continue to benefit from a focus on tech self-sufficiency goal amid growing external pressures. Select industrials, such as the heavy-duty truck market, are expected to be supported by a strong replacement cycle and expanded subsidies for China IV standard trucks. Lastly, consolidation in old economy sectors tied with ongoing reforms around state-owned enterprises (SOE) and higher dividend yields also present defensive opportunities. An SOE re-rating seems possible, in our view, given improving fundamentals, while stalwart sectors such as premium liquor could also see a recovery.
Valuations for Chinese equities have come down significantly since a September 2024 rally.17 With market expectations subdued and valuations more aligned with historical norms, we see room for growth in 2025. Favorable policy announcements and abating geopolitical headwinds may provide room for reversal, though we would caution that low valuations themselves are seldom reason alone for re-rating and focus should remain on earnings. While predicting a sentiment turnaround is difficult, any improvement in confidence may trigger a sharp reversal, providing valuation support.
Going Deep into Differentiated Long-term Themes
Reshoring is sparking an industrial renaissance in select developed markets, notably the US. We believe this trend has been strengthened by the US election outcome. Supply chain reconfiguring will likely see an acceleration in activity, in our view, as the industrial economy rebounds and there is further clarity on US policy under President Trump. Energy deregulation in the US could be beneficial to the natural gas sector as the US produces more energy with steady demand from government and various sectors for energy that is affordable, reliable, and sustainable. Defense spending continues to increase globally due to new threats emerging. The Trump administration will drive more spending from NATO countries that are below the 2% of GDP spending target.18
Semiconductor reshoring continues to be a focus globally. US fab capacity is projected to triple over the next decade, increasing by as much as 203%, which is the largest projected percent increase in the world.19 Previously, US fab capacity grew 11% over the last decade (2012-2022).20 The country’s global share of chip manufacturing capacity is expected to rise from 10% to 14% by 2032, signaling growth for the first time in decades.21 The US is positioned to secure more than one-quarter (28%) of global capital expenditures between 2024-2032, trailing only Taiwan, which amounts to an estimated $646 billion.22
Announced spending for mega projects continues to accelerate in the US. Over $940 billion in “mega project” ($1billion+ value) investments have been announced since 2021, of which over $270 billion have broken ground.23 This number is up $415 billion from 2022 and $81 billion from 2Q23 to 4Q23.24 Given that there is typically a 2–3-year lag between when projects are announced and when industrial companies realize revenues, we believe the revenue acceleration and industrial growth inflection point is still yet to fully emerge.
We also expect a significant step change in electricity demand. Estimates call for an additional ~700 terawatt-hours of power demand by 2030 in the US alone, driven by the reshoring of manufacturing capacity as well as AI/data center buildouts and growth in electric vehicles.25 The increasing demand for power from data centers could require an additional amount of energy equivalent to three New York cities by 2030.26 New energy resources and transmission and distribution infrastructure will be necessary to keep up with the growing demand, transforming utilities into a dynamic sector with significant growth potential. This sector could play a crucial role in enabling technological advancements.
1 Furey Research Partners. As of December 31, 2024.
2 Furey Research Partners, FactSet. As of October 31, 2024.
3 Furey Research Partners, FactSet. As of October 31, 2024.
4 Goldman Sachs Asset Management, FactSet. As of December 31, 2024.
5 Goldman Sachs Global Investment Research, FactSet, as of February 7, 2025, using bottom-up consensus EPS growth estimates
6 Furey Research Partners, as of December 31, 2024.
7 Statista, Annual TOPIX performance 1980-2024, published January 6, 2025.
8 Goldman Sachs Investment Research. As of November 18, 2024.
9 Goldman Sachs Investment Research. As of February 7, 2025.
10 Goldman Sachs Investment Research. As of December 2024.
11 Goldman Sachs Global Investment Research. As of February 7, 2025.
12 FactSet. As of December 2024.
13 Goldman Sachs Investment Research. As of January 24, 2025
14 MSCI. As of December 31, 2024.
15 Goldman Sachs Global Investment Research. As of November 19, 2024.
16 Bloomberg, Goldman Sachs Global Investment Research. As of January 10, 2025.
17 Bloomberg, Best P/E Ratio. As of December 2023.
18 US Department of Defense. As of February 2024.
19 Goldman Sachs Asset Management. SEMI. BCG Analysis. As of 2024.
20 Goldman Sachs Asset Management, SEMI, BCG Analysis. As of 2024.
21 Goldman Sachs Asset Management, SEMI, BCG Analysis. As of 2024.
22 Goldman Sachs Asset Management, SEMI, BCG Analysis. As of 2024.
23 Goldman Sachs Investment Research. As of 2024.
24 Goldman Sachs Investment Research. As of 2024.
25 Wells Fargo. As of 2024.
26 Apollo, McKinsey, NextGen. As of 2022.