Market Know-How 1Q 2026
(A)Ideas for 2026
AI is already transforming economies and financial markets; its ultimate trajectory remains the central question for investors.
Billions of dollars are flowing into AI models, data, and compute globally. This AI-driven capex from creators, enablers, and users of AI is reshaping investment opportunities, necessitating the scaling of traditional infrastructure (energy, transmission, and data connectivity) and swift capital reallocation across sectors and regions.
The dramatic expansion of AI's application and penetration over the past two years is poised to continue, in our view. This comes with the potential for substantial labor productivity gains, stronger early adopter margins, and significant capital reallocation to AI-intensive models. However, uneven adoption across economies, sectors, and firms will generate both alpha opportunities and new risks.
In this edition of the Market Know-How we highlight some of the areas where we see near-term implications for investors grappling with the consequences of AI as we head into 2026. In particular, we:
- Highlight which Emerging Markets are currently the most integral to the global AI ecosystem and set of supply chains.
- Map the critical infrastructure buildout required to support AI—and the associated investment opportunities.
- Consider the implications of AI on fixed income markets through its possible impact on key macro variables.
AI is not a distant prospect; it is a present macro and market force. For investors, we believe this calls for a deliberate recalibration of exposures to reflect AI’s large and rapidly growing footprint in the global economy and financial markets.
Short-Term Macro Themes
We expect global growth to remain robust in 2026, underpinned by reduced trade-policy uncertainty, a supportive fiscal stance, accommodative financial conditions, and sustained AI-driven capital investment.
Onwards and upwards
- We expect a continued expansion of global economic growth in 2026, with most major economies contributing to above-trend growth. In the US, activity should stay robust, underpinned by strong AI-related capital expenditure, still-easy financial conditions, and a positive fiscal impulse from the "One Big Beautiful Bill". In the Euro area, growth looks set to run above potential as the region continues to prove resilient in the face of lingering trade uncertainty. The German fiscal stimulus, a still-healthy labor market, reduced trade-policy headwinds, and supportive credit flows should collectively sustain domestic demand and investment. In the UK, a fiscal drag and the prospect of sluggish real income growth might dampen growth, but monetary policy easing is likely to support consumption, and UK exports could benefit from a global synchronized re-acceleration. Japan is also poised for another year of solid performance, with domestic demand in the driver’s seat: a tight labor market, powerful incentives to invest in labor-saving technologies, and targeted fiscal measures should keep growth on a firm footing.
Growth in sync, policy out of step
- Against this macro backdrop, monetary policy is likely to remain a key differentiator across economies. In the US, we expect the Fed to cut rates further in 2026, but above-trend growth argues for only limited additional easing. That said, the appointment of a dovish new Fed Chair could point to somewhat more room for cuts, depending on the extent to which the new Chair manages to convince the rest of the FOMC of their policy views.
- After resuming its easing cycle in December, the BoE is also likely to cut rates further to a terminal rate of 3%, as inflation risks are more balanced following a more conservative Autumn Budget.
- By contrast, the ECB may well stay on hold for an extended period, with any further cut requiring a clear catalyst such as a material downside growth surprise or a sharp euro appreciation. While not our base case, if the recovery were to gain traction, rate hikes could return to the discussion in the second half of 2026.
- In Japan, continued reflation progress supports our call for continued modest tightening by the BoJ, particularly if the Shunto negotiations confirmed firmer wage growth heading into 2026 and/or yen weakness amplified imported inflationary pressures.
China’s new model
- We expect China's growth to remain robust in 2026, supported by its strategic focus on high-tech manufacturing and the development of a modern industrial system.
- Over the past two years, Chinese exports have accounted for more than half of headline real GDP growth, showcasing remarkable resilience even in the face of steep US tariffs. The proposal for the 15th Five-Year Plan (2026–30), approved at the 4th Plenum in late October, signals that Beijing is doubling down on this strategy. Xi’s dual-circulation agenda is designed to deepen global dependence on China’s supply chains while making China more self-reliant and less import-intensive—a clear departure from the country’s earlier growth model.
- On the back of this shift, our China team has raised its forecast for real GDP growth in 2026-30 to an annual average of 4.5%, compared to 4.0% before.1
It’s mostly fiscal
- We expect fiscal policy to remain in focus in 2026, with a new economic package in Japan, federal spending accelerating in Germany and potential new measures to be announced in the US ahead of the Midterm elections.
- In Japan, the Cabinet approved the new ruling coalition's economic package with a supplementary budget of ¥17.7 trillion (~2.8% of GDP) at the end of 2025, up from ¥13.9 trillion in 2024. The package consists of four pillars, led by measures to address high prices but also including crisis management and growth investments, strengthening defense capabilities, and reserve funds. As the supplementary budget includes many items for which actual spending will be delayed until FY2026 or beyond, we expect it to increase the fiscal deficit this year.
- In Germany, we continue to anticipate a pick-up in fiscal spending, which underpins our positive view on Euro area growth more generally. However, the pace of fiscal spending in October and November, the first two months after the 2025 German budget was passed, was substantially below what required to meet budget targets.
- Finally, in the US, the One Big Beautiful Bill Act is expected to provide a much-needed boost to consumers. While not our base case, additional fiscal support could be announced in the coming months. For example, in early November, President Trump floated the idea of issuing a $2,000 dividend to middle- and lower-income individuals from the tariff revenues collected.
Bridging consumer weakness
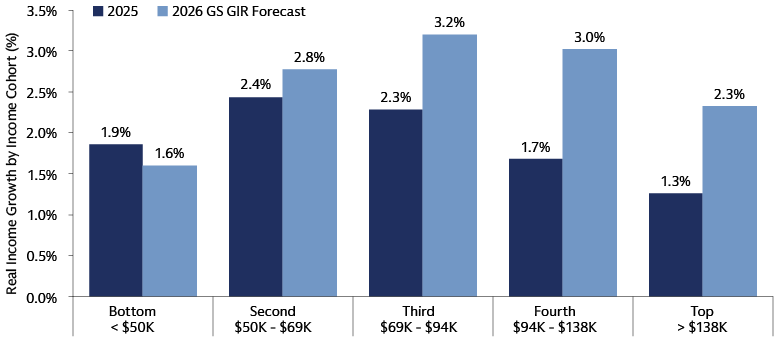
- A significantly weaker US labor market remains a key risk in 2026. The current low-hiring/low-firing equilibrium limits immediate pain but carries a real risk of a sharper, reflexive adjustment down the road.
- For now, heavy AI-related investment and resilient spending by high-income households (which account for roughly 40% of total consumption) are bridging this soft patch. However, we believe the US Administration may need to focus on lifting real incomes for lower-paid workers in 2026, as the tax relief from the One Big Beautiful Bill Act is likely to disproportionately benefit individuals on the higher-end of the income distribution.
Source: Goldman Sachs Asset Management and Goldman Sachs Global Investment Research. As of January 5, 2026.
AI to the rescue?
- While we are yet to see a broad-based productivity boost from AI adoption, AI-related investment is already having an impact on US GDP growth: AI-related spending accounted for almost one percentage point of US real GDP growth in H1 2025. Without it, US GDP would have almost flat-lined.
- Hyperscalers capex is expected to reach $540 billion in 2026,2 with Nvidia’s CEO Jensen Huang anticipating $3-4 trillion of AI infrastructure spending by 2030.3 However, rising debt issuance by hyperscalers, and the increasing circularity of the AI ecosystem are raising concerns about the sustainability of growth expectations in the sector, especially considering already high valuations and the limitations stemming from the ability to scale up energy production in the short term.
Long-Term Macro Themes
In our view, the next economic cycle will be characterized by higher inflation, elevated interest rates and heightened macroeconomic volatility, driven by six key factors. We believe investors need to position their portfolios for CHANGE.
CHANGE
Climate transition – High level of debt – Ageing demographics – New finance – Global fragmentation – Evolving technology
Source: 2025 AI Index Report, IMF World Economic Outlook and Goldman Sachs Asset Management. As of January 1, 2026.
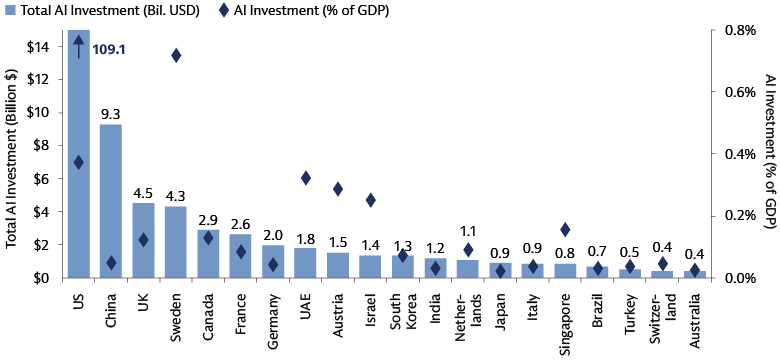
- We believe AI has the potential to significantly alter both the economic and investment landscape. The headline contribution to activity so far largely reflects capacity build-out rather than broad-based productivity improvements. Unsurprisingly, AI-related investment has been overwhelmingly dominated by the US, followed with a large gap by China. This concentration means the immediate boost to real GDP is primarily investment-led and geographically uneven.
- Recent industry surveys already show a significant pick-up in AI adoption in the US and in China with pockets of efficiency gains, but by and large companies remain in the early innings of AI adoption. Translating capital spending into sustained output-per-worker gains is typically a multi-year process that requires diffusion, reskilling and complementary investment.
- Cross-country differences in AI capex, both in scale and composition, suggest that productivity paths may diverge over time. Economies with deeper innovation ecosystems, supportive regulation and strong digital infrastructure may be better positioned to capture efficiency gains, while others could see more modest impacts.
- From an investment perspective, so far, the sheer scale of AI-related capex has primarily supported stocks exposed to the infrastructure build-out. The process of AI adoption remains early, but large companies report more progress so far than smaller firms. We believe market focus will soon turn to AI-enablers and applications. With this in mind, we believe there is an attractive opportunity beyond the large US big tech companies as AI broadens out, particularly in the small cap space and EMs.
- More generally, we think it is important for investors to consider dedicated allocations to technology going forward given the acceleration and pace of the industry's disruption, leading to potential wealth creation opportunities.
Market Themes
We are constructive on risk assets with a preference for equities as current credit spreads offer limited compression potential. We see stronger returns in EM equities driven by superior earnings growth and more attractive valuations. Even with fiscal concerns, we believe core fixed income can offer portfolio diversification given reduced inflation risk and steeper yield curves. Amid further monetary easing and healthy global growth, we expect the US dollar to decline modestly.
Upside scenario #1: Productivity boom
AI boosts productivity faster and further than expected, leading the global economy (led by the US) to experience a new era of rapid economic growth, potentially reaching levels not seen since the late 1990s.
Key Implications: Global tech surges, followed by EM equities. Inflation stays in check, a result of the disinflationary impact from enhanced productivity. This allows for higher revisions in economic potential growth, which in turn keeps long-duration bond yields elevated.
Upside scenario #2: Russia/Ukraine ceasefire
Energy prices fall with the recovery in Ukrainian production capacity and potential removal of sanctions on Russia, while European growth accelerates via higher real income and improved consumer and business confidence.
Key Implications: European (DM and EM) equities rally on the back of a valuation boost and higher expected earnings from the reconstruction of Ukraine. Given the extent of the reconstruction job, European credit and financials may also benefit, as well as infrastructure.
Downside scenario #1: AI disappointment
Tech capex is scaled down significantly as businesses question the viability of current AI expectations. The US economy slows as corporates scale back investment and the stock market sells off, creating negative wealth effect and prompting higher-income consumers to slow spending.
Key Implications: Global equities experience a correction while defensive sectors, such as Healthcare, and high-dividend stocks stay more resilient. European equities outperform given lower exposure to the AI theme. Long-dated government bonds and liquid alternatives help reduce the overall portfolio drawdown.
Downside scenario #2: Germany letdown
The German government underdelivers on its infrastructure and defense budget, perhaps because of political divide, weighing on confidence. Germany grows below expectations, dragging down growth in the Euro area more broadly.
Key Implications: European domestically exposed stocks come under pressure as lower Euro area growth is priced in. European core fixed income provides some buffer: duration rallies as more cuts by the ECB are discounted.
Emerging Market Equities
SOLUTION
AI's hidden engine
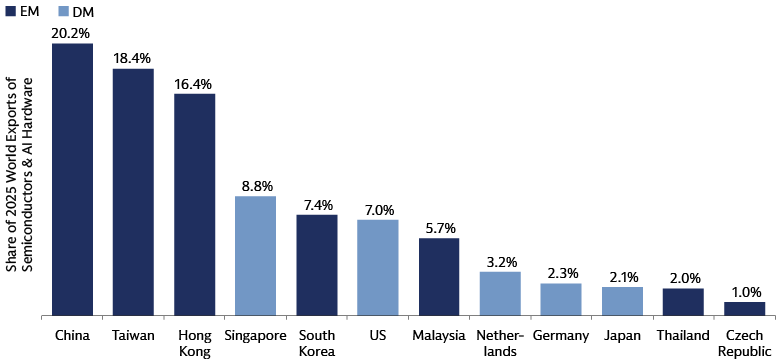
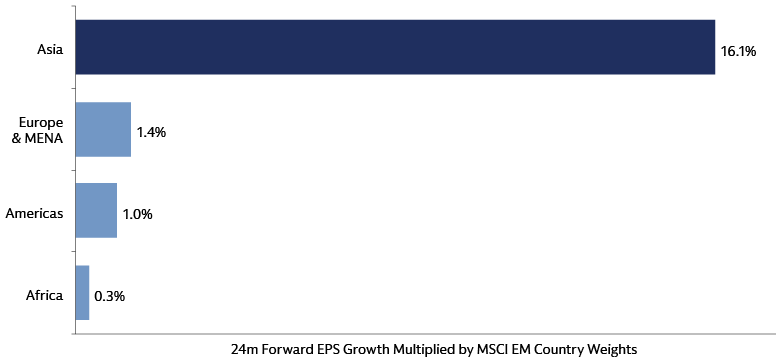
The global surge in AI, cloud computing, and digital infrastructure is unlocking powerful growth opportunities—placing emerging markets at the center of this structural shift. The US may lead in AI capital expenditure, but this transformation depends on the manufacturing strength and supply-chain depth of EMs. Around 70% of YTD global exports of semiconductors and AI hardware originate from EMs, making them crucial in enabling this global transformation. EM increased role in the AI supply chain has translated into a growing representation of tech in equity benchmarks, with the MSCI EM index’s IT sector weight rising from about 14% a decade ago to 27% today, at the detriment of more traditional sectors. The combination of manufacturing depth, significance in AI supply chains and lower valuations leaves EMs well placed to be long-term beneficiaries from this shift, in our view.
Broadening leadership
Asia was the key driver of EM outperformance in 2025, led by South Korea, Taiwan and China as hyperscalers’ capex and semiconductor demand fueled one of the strongest upcycles on record. 24-month forward EPS growth expectations suggest this momentum is likely to persist. Importantly, we believe the opportunity extends beyond Asia, with other regions likely to catch up as valuations remain below those of EM Asia. The structural depth of the EM technology ecosystem is a key differentiator—spanning not only chip manufacturing but also data center infrastructure, thermal management and power solutions. This breadth, combined with strong visibility of earnings, boosts confidence in the durability of these trends, in our view. For example, SK Hynix’s order books for next year are already full, signaling predictable revenue streams rather than speculative growth. In LatAm, fintech is emerging as a powerful theme, with companies such as NuBank and MercadoLibre leveraging technology to capture market share in a region with low penetration of financial products. These tech-centric business models, long associated with developed markets, are increasingly driving domestic consumption growth in EMs, reinforcing our conviction that the case for EM equities is structural rather than cyclical.
Source: ITC Trade Maps and Goldman Sachs Asset Management. As of January 5, 2026. *Includes data up to and including September 2025. Chart shows a sum of HS 8541, 8542, 8471 and 8473.
Source: Bloomberg and Goldman Sachs Asset Management. As of January 5, 2026. Latest MSCI EM country weights data is December 31, 2025.
Rates
SOLUTION
A productivity anchor for real rates
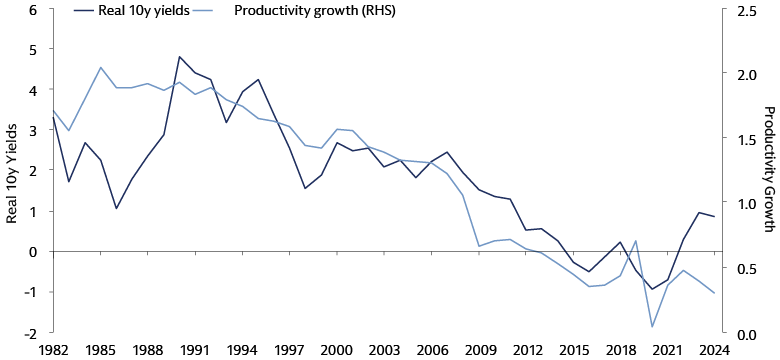
Historically, long-term real interest rates have tended to track underlying productivity trends: periods of stronger productivity growth have coincided with firmer 10-year real yields, while persistent weakness in productivity helped push equilibrium real rates lower in the 2000s and 2010s. The mechanism is straightforward. Higher trend productivity makes capital more valuable, which, all else equal, puts upward pressure on the equilibrium real rate. However, the magnitude varies across countries, contingent on capital deepening, labor reallocation and structural policy. Recent market trends, shown by moves in forward real yields and term premia, already reflect a shift towards higher long-term real rates, as investors prepare for an AI-driven productivity boost. We believe this process to play out over the medium term and to unfold more fully over the coming decade.
An AI lift to yields
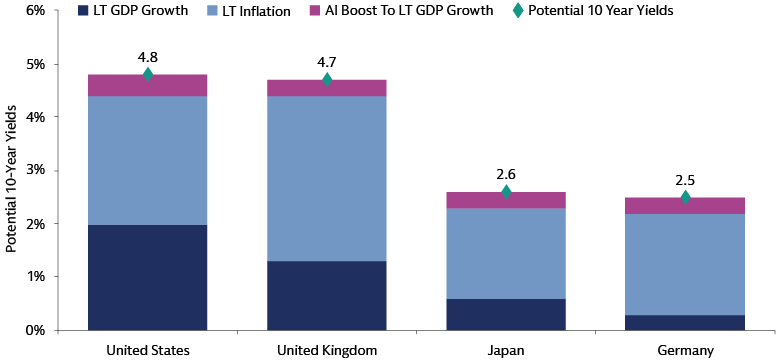
In our view, a realized productivity boost from AI would probably translate into higher 10-year bond yields over time via stronger potential growth and higher equilibrium real rates, though the timing and size of that repricing are uncertain and uneven across geographies. Under plausible productivity and inflation assumptions implied by AI adoption, potential 10-year yields could be materially higher in some markets—notably the US and the UK—and only modestly higher in others-like Japan and Germany. This cross-country divergence reflects differences in the scale of capex, digital infrastructure and the speed of adoption. Key risks that would blunt any repricing include slower adoption, labor frictions, and policy responses that offset productivity gains. We therefore favor measured positioning that hedges against both a gradual re-anchoring of long real rates and the short-term inflationary pressures that can accompany a front-loaded capex cycle.
Source: OECD and Goldman Sachs Asset Management. As of January 1, 2026. G7 productivity growth is calculated by taking a simple average of the 10-year moving average of productivity growth for each of the G7 countries. G7 Real 10-year yield is calculated by taking a simple average of the real 10-year yield for each of the G7 countries. This in turn is calculated by subtracting the 10-year moving average of inflation from the 10-year nominal yield. Please refer to the end of this publication for additional disclosures.
Source: Goldman Sachs Global Investment Research, Macrobond and Goldman Sachs Asset Management. As of January 2, 2026. LT GDP Growth estimates based on the 10-year Real GDP growth forecasts produced by Goldman Sachs Global Investment Research. LT inflation based on 10-year inflation swaps. AI Boost to LT GDP Growth is based on a conservative interpretation of published estimates that account for continued technological progress that is already built into existing estimates of trend growth and a slowing Ex-AI productivity growth trend. This estimates a growth boost of 0.4pp in the US, 0.3pp on average in other DMs, and 0.2pp on average in advanced EMs by 2034. Please refer to the end of this publication for additional disclosures.
Infrastructure
SOLUTION
Digital infrastructure takes center stage
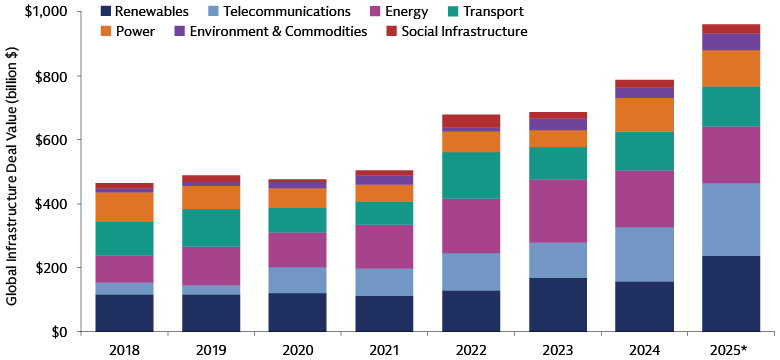
The AI revolution is still in its build-out stage and global infrastructure is leading the charge—underscored by rising deal values as investors position for transformative, long-term growth. A notable example is telecommunications, where deal value has tripled since 2018, driven by fiber, towers and data centers that enable cloud and AI adoption. These assets have become essential for connectivity and processing power as data volumes surge, and we expect their growing importance to modern economies to remain a key support for rising global deal values in the years ahead.
Powering the transition
The surge in infrastructure investment brings a critical challenge: the energy required to sustain it. As data centers scale and AI adoption accelerates, global electricity demand is set to rise sharply—data center consumption alone is expected to more than double by 2030, matching Japan’s current usage. Meeting this demand will require major upgrades to ageing grids and a balanced mix of traditional and renewable generation. We believe that electricity costs are another key factor that may help attract capital towards cost-efficient solutions powering the digital economy. At the same time, grid resilience, distributed generation, and energy-efficiency solutions are gaining prominence as policymakers and investors strive to align rapid digital growth with reliability and climate goals. In our view, this positions infrastructure not only as a critical enabler of technological progress but also as a long-term winner in the energy transition.
Source: Infralogic Rankings Report Q3 2025 and Goldman Sachs Asset Management. As of January 1, 2026. *The latest data is Q3 2025.
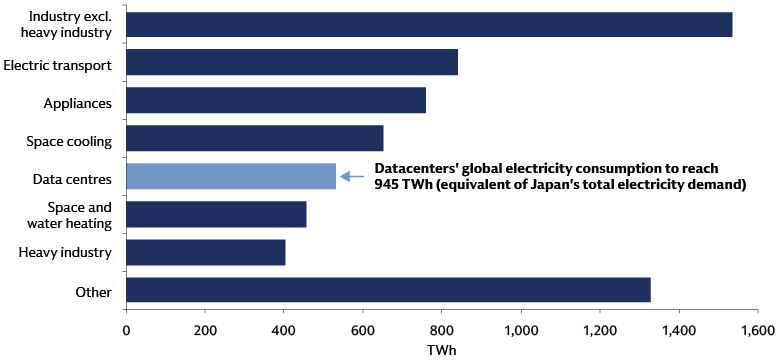
Source: IEA and Goldman Sachs Asset Management. As of January 1, 2026. The estimates shown were published by the IEA in April 2025.
What Record ETF Flows Signal About Market Dynamics
ETF dominance reinforced
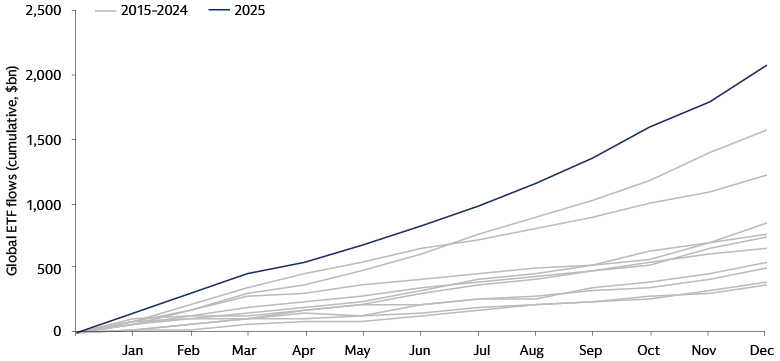
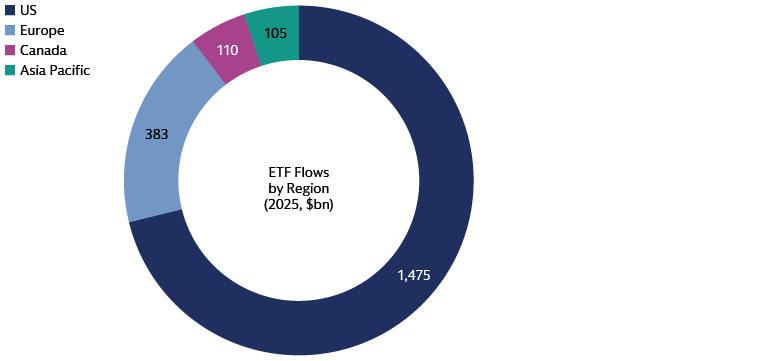
2025 marked a pivotal year for global capital markets, with ETFs emerging as a key indicator of structural change. Record inflows of nearly $2.1 trillion reflect deeper trends shaping investor behavior: the migration from traditional vehicles, generational wealth transfer, and growing demand for liquidity and transparency. These flows highlight how innovation within investment structures—rather than specific products—is redefining portfolio construction globally. While the US maintained its dominant share, capturing 71% of the inflows, Europe’s above-trend growth, attracting 19% of inflows versus 17% of AUM, signals a gradual narrowing of the gap, underscoring the global nature of this evolution.
Source: Goldman Sachs Asset Management. As of December 31, 2025.
Source: Goldman Sachs Asset Management. As of December 31, 2025.
Innovation in active ETFs
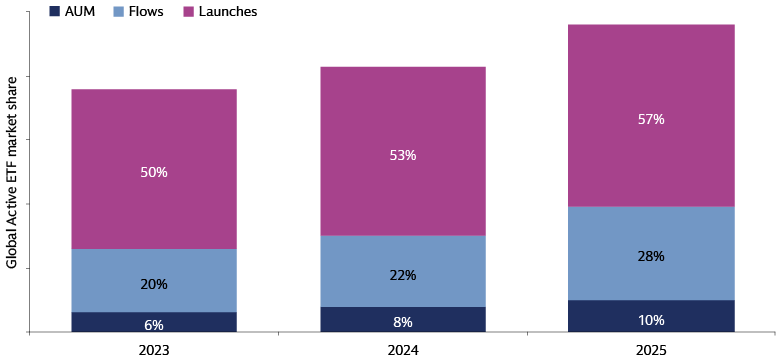
Perhaps the most notable development was the acceleration of active strategies within the ETF framework—a shift that speaks to investors’ appetite for flexibility and sophistication. Active ETFs, once a niche, now represent 10% of assets and captured nearly a third of flows in 2025. This trend reflects a broader move towards solutions that combine efficiency with alpha-seeking and risk management features, including options-based strategies. Regional variations are emerging: the US leads in derivative income ETFs, while Europe is seeing rapid adoption of buffer ETFs (options trading ETFs) designed for downside protection. These innovations illustrate how market architecture is evolving to meet complex investor objectives.
Source: Goldman Sachs Asset Management. As of December 31, 2025.
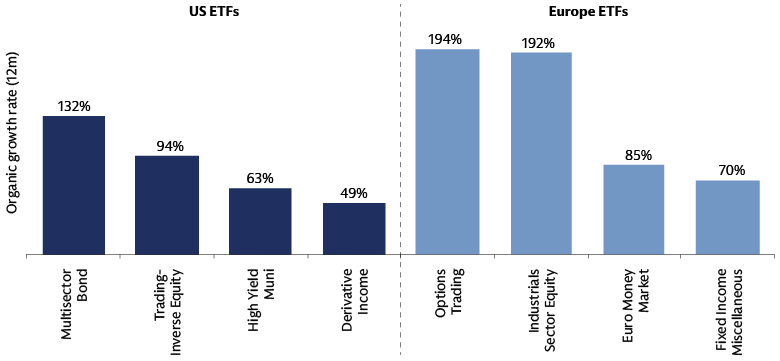
Source: Goldman Sachs Asset Management. As of December 31, 2025.
Looking ahead
The rise of ETFs—both passive and active—underscores a fundamental shift in how capital is allocated. Beyond product innovation, this trend signals a reconfiguration of market structure, liquidity dynamics, and investor priorities. As we look to 2026, the question is not whether ETFs will grow, but how their evolution will shape the broader investment ecosystem and influence global capital flows.
For a table on Relative Asset Class Calendar-Year Performance and our view on Short-to-Medium and Long Term potential solutions, we encourage you to download the full PDF.
1 Goldman Sachs Global Investment Research. China Matters: “Sticking with What Works: Raising GDP Forecast on China’s Manufacturing”, October 30, 2025.
2 According to consensus estimates. Hyperscalers include AMZN, GOOGL, META, MSFT, ORCL.
3 As of Nvidia's Q2 2025 conference call.
