Market Pulse October




Macro Views

The cyclical impulse from a trillion dollars in cumulative AI capex and trillions more in government spending has been evident in the global activity pickup. Led by strong industrial and manufacturing activity, Q3 GDP growth is tracking 3.4% in the US, 0.8% in the Euro area, and 4% in China. We expect modest acceleration in 2027 as energy headwinds fade and consumer spending adds to robust corporate investment.

Core is close to target in most countries but still notably higher in the US, where goods inflation remains elevated due to boosts from tariffs and tech-flation while services have largely normalized. Goods inflation elsewhere has returned to long-run trends due to increased Chinese goods supply, while service, shelter, and labor prices pressure more in non-US DMs.

Our forecasts are on the dovish side of market pricing as we expect inflation normalization to continue. We anticipate one more hike this year from the FOMC, ECB, and BoE, and then a pause to watch the data. Further hikes in 2027 would likely require a material acceleration in prices, jobs, and/or growth.
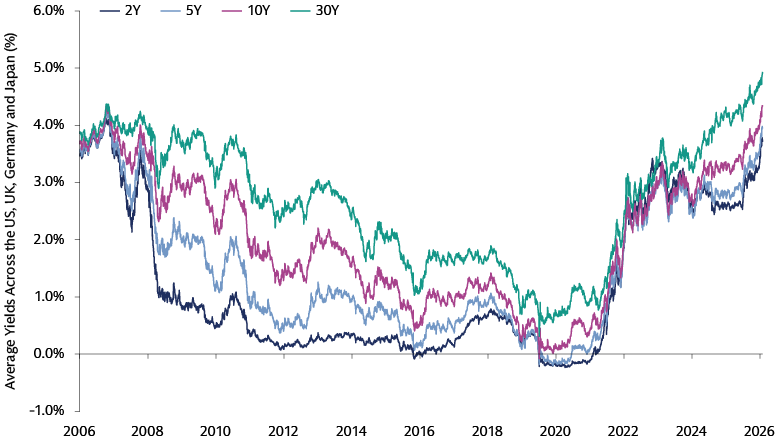
Source: Bloomberg and Goldman Sachs Asset Management. As of September 30, 2026. Past performance does not predict future returns and does not guarantee future results, which may vary.
Market Views

Stronger growth expectations, sticky inflation, and hawkish policy shifts have propelled global rates higher. Global AI-related debt issuance nearing $600bn YTD – roughly 40% of which is from the high-grade hyperscalers – is also competing for capital. We think the income environment remains attractive but are mindful of spread risk in credit markets, maintaining an up-in-quality bias and being selective within AI.

Higher for longer interest rates are largely priced into equity markets, but rapid rate moves may still cause some chop. Historically, a two standard deviation move in the US 10Y (~50bps today) is the speed limit. Investors today may have support from multiples that have already come in, with S&P 500 forward P/E now at 21x versus 25x a year ago, and EPS growth tracking for 36% in 2026 and forecasted for double digits in 2027 and 2028.

Oil exports from the Middle East have recovered to roughly prewar volumes despite the partial closure of the Strait of Hormuz and disruptions in the Red Sea. Oil prices may also recover as supply-demand balances normalize. However, the shortage of refining capacity may mean continued elevated product prices for diesel, jet fuel, and gasoline.
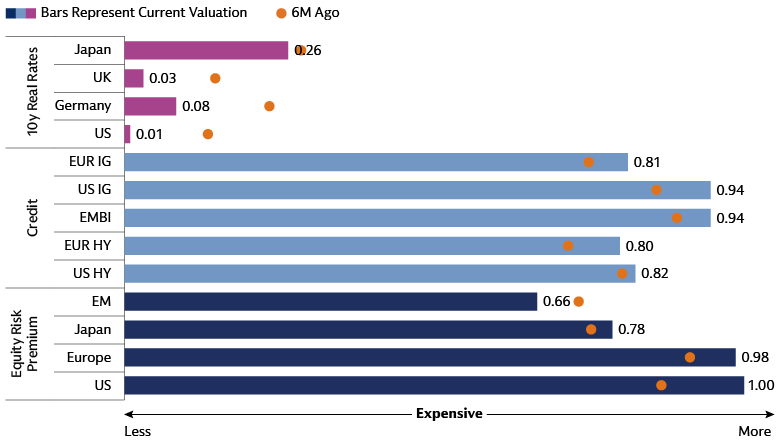
Valuations Across Assets (Historical Percentile): Source: Bloomberg, Haver, MSCI and Goldman Sachs Asset Management. As of October 1, 2026. Chart shows the Equity Risk Premium = 12M forward earnings yield (1 / Bloomberg Best 12M forward P/E) less 10Y real yield; country-specific for US/Japan, Germany for Europe and the US for EM. Credit = respective index spreads; 10Y real yields = 10Y nominal yield less 10Y breakeven inflation. Historical percentile: Monthly observations since November 2006 are used to rank each valuation metric against its historical distribution.
Harvest Yield
Global bond yields have risen sharply, driven by stronger nominal growth, lingering inflation, fiscal concerns, and increased competition for capital from AI. Yields sit at attractive levels, though a sustained rally may require lower energy prices or slower growth. We believe investors should prioritize carry (the income received for holding a bond) and favor areas of the market that may offer the most attractive yields relative to their risks. Given that starting yields are the strongest predictor of future returns, we think higher rates can offer attractive potential for fixed income investors today.
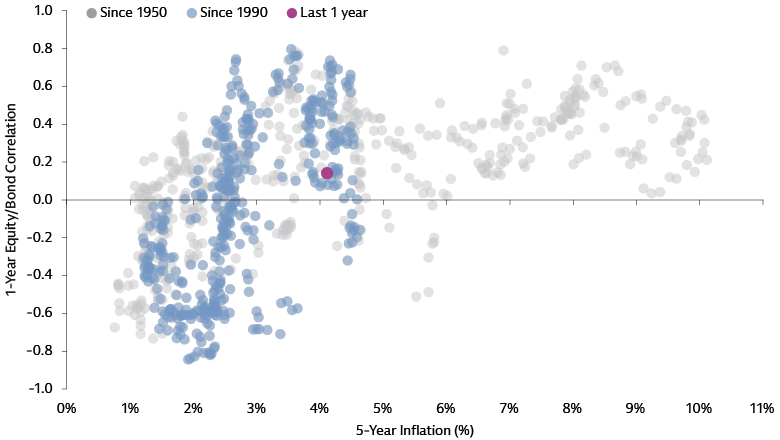
Source: Goldman Sachs Global Investment Research. As of July 31, 2026. Chart shows the relationship between equity and bond prices based on different inflation regimes. A correlation closer to 1 implies a stronger relationship, a correlation closer to 0 implies a smaller relationship.
The role that bonds play in a portfolio depends in large part on the rate of inflation. Equity/bond correlations are more positive in inflationary environments, limiting their hedging potential – as we have seen post-covid and in reflationary regimes of the past. Going forward, we think continued disinflation can make correlations less positive, but bonds will increasingly be more of a tool for income generation rather than risk mitigation.
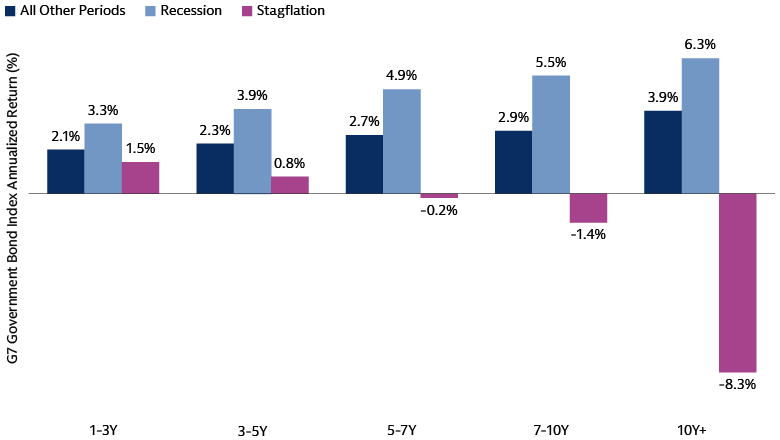
Source: Macrobond and Goldman Sachs Asset Management. As of October 1, 2026. Chart shows global bond performance in different environments. Recession refers to when G7 CPI is <2.5% and G7 composite PMI is <48. Stagflation refers to when G7 CPI is >3.5% and G7 composite PMI is <50. G7 refers to Canada, France, Germany, Italy, Japan, United Kingdom, and United States.
Markets have faced both growth and inflation risks this year, leading to rapid repricing of curves around the world. We believe dynamic bond strategies that can actively adjust duration, sector, and/or regional exposure are well poised to navigate uncertainty and capture potential opportunities across changing market conditions. Given the balance of risks today, the front of the curve appears to be the best all-purpose option for rates moving higher, lower, or holding steady.
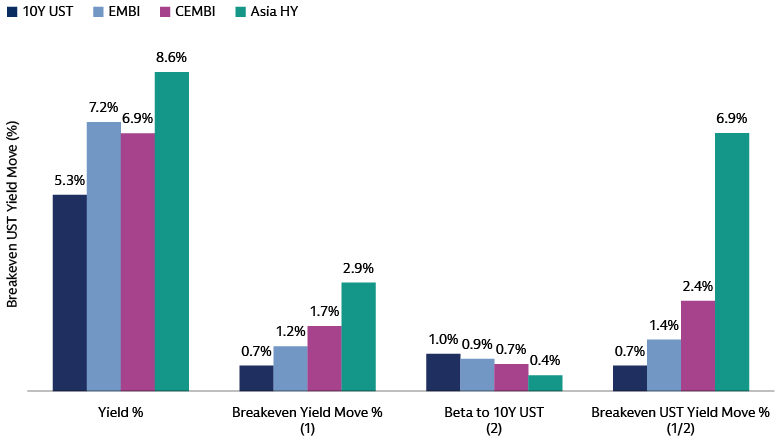
Source: Macrobond and Goldman Sachs Asset Management. As of October 1, 2026. Data are sourced from Macrobond and cover the ICE BofA 10-Year US Treasury Index, ICE BofA Asia High Yield Corporate Constrained Index, J.P. Morgan EMBI Global Diversified Index and J.P. Morgan CEMBI Broad Diversified Index. Breakeven yield move is calculated as index yield divided by modified duration or duration to worst, as applicable. Beta to the 10-year US Treasury yield is estimated using monthly observations from September 2014. Breakeven UST yield move is calculated as the breakeven yield move divided by the estimated beta.
EM debt’s starting yield can help cushion against higher rates. Our analysis estimates how much of a Treasury sell-off EM Debt can absorb before duration drives total returns negative. Stronger monetary and fiscal frameworks, healthier external balances and lower sensitivity to UST yields have improved resilience. This reframes the allocation decision from predicting rates to assessing whether attractive income adequately compensates investors for volatility and policy uncertainty.