Exploring Alternative Dimensions Across Private Markets in 2026

Key Takeaways
This article is part of our Investment Outlook 2026: Seeking Catalysts Amid Complexity
Private Equity
Are valuations fair?
Establishing the basis for comparison
In 2023, we noted the disconnect between median holding and exit valuations as one indicator that holding valuations were likely over-valued (at the median) and a headwind to exit activity. That valuation gap appears to have narrowed in 2Q 2025, with both median exit and holding multiples reaching record highs.1 However, recent transaction activity has been skewed towards higher-quality companies, which command a valuation premium. This means that aggregate transaction statistics are biased upwards, suggesting that holding values are elevated, although with meaningful dispersion across individual sectors and holdings. Some assets on the books are likely overvalued and will need to take a markdown in order to be sold, while others are fairly marked. This is broadly consistent with a recent survey that showed general partners (GPs) are willing to accept 11-20% discounts in a quarter of cases in order to sell long-held assets.2
Extending the public markets’ “PEG” (P/E to Growth) ratio concept to private equity, holding valuations relative to EBITDA (earnings before interest, taxes, depreciation, and amortization) are somewhat elevated relative to history as well. This is less the case for higher-quality assets than at the median, suggesting that the premium has largely been justified within the broader valuation picture.
Today’s private market valuation discount to public markets is marginally smaller than the long-term average, suggesting a slight overvaluation on this metric. Overall, valuations are high in both public and private markets—but have been supported by strong earnings growth.
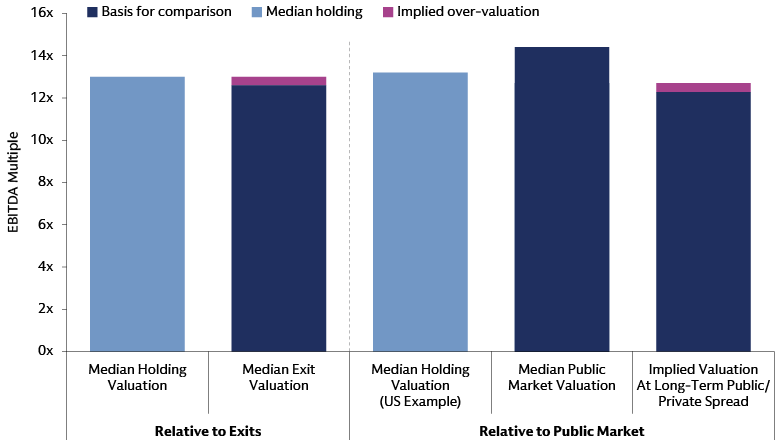
Source: Goldman Sachs Asset Management calculations; underlying data source: MSCI Private Assets, as of June 30, 2025. Data of holdings vs. exit valuations is for global buyouts. Data relative to public markets is for US buyouts; public markets valuations based on S&P 500.
With economists forecasting continued positive GDP growth, the outlook does not point to a major catalyst for a systematic downward re-rating of values the near term, in our view. Valuation regimes typically change due to underlying growth trajectories, rather than in response to absolute valuation levels.3
Conversely, further valuation upside also lacks obvious catalysts, given already rich starting valuations and an interest-rate path that is likely range-bound and broadly priced. Net-net, absent a macro or exogenous shock, we believe private equity multiples should remain range-bound in the near term, although investors will continue to pay a premium for assets with strong fundamentals and forward growth prospects.
IPO markets are seeing better momentum, with deal activity recovering from last year and a growing backlog. M&A activity has grown as well, with deal volumes up 43% year-over-year albeit driven by larger transactions.4 Exit activity has picked up, but it remains muted relative to overall net asset value. We believe a more widespread resumption of exit activity is predicated on sellers accepting a discount to holding valuations where warranted.
Starting points matter
Even with a constructive market backdrop, private equity return implications will vary widely by company; entry points should also be a key factor.
- 2021-early 2022 cohort: Likely to be challenged, in our view, having been underwritten at peak valuations and facing a more difficult operating environment than initially anticipated. While many investments will do well (and some high-quality companies have exited this year), the overall cohort may require extended hold periods and/or may fail to reach full return targets.
- 2018-2020 cohort: Positioned for attractive returns for companies whose fundamentals have remained healthy—having been underwritten at lower median multiples.
- Earlier investments still held: Potentially the most troubled, as healthy assets likely sold during 2020-2021's favorable conditions (between the COVID-19 disruption and the rising-rate environment); remaining assets are likely lower quality.
We believe a more robust exit environment will expose the dispersion in manager track records and give Limited Partners (LPs) concrete data to evaluate existing and potential new relationships. The ability to create value should come to the forefront, and differences in managers’ accounting and valuation practices should become more apparent as LPs gain information about portfolio companies’ exit valuations compared to pre-transaction holding valuations.
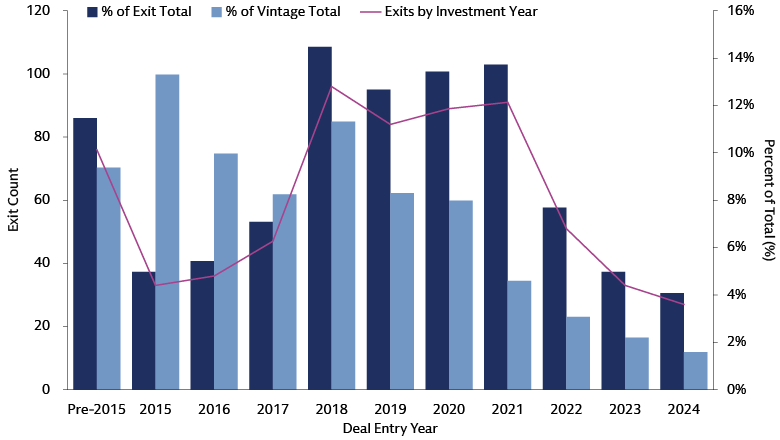
Source: Goldman Sachs Asset Management, Based on PitchBook Data. As of 4Q 2025.
Outlook for new capital deployment
Our outlook for new capital deployment in private equity indicates that companies require approximately 10-15% annualized EBITDA growth, somewhat above long-term averages, to achieve historical levels of targeted returns.5 This level of EBITDA growth would require a combination of margin expansion and revenue growth that are slightly above what has been achieved historically. This comes at a time of expectations for reduced macro tailwinds; economists project nominal GDP growth to be positive but ~70bps lower over the next five years compared to the last decade, with a larger portion attributed to inflation, which can complicate margin expansion.
We believe managers will need to strategically identify growth areas that exceed overall economic growth. A shift in geographic focus may be necessary, given the differing macro dynamics across global economies.
The pursuit of higher-growth sectors is expected to continue. These sectors include technology and healthcare: among private equity-backed companies in the sectors, median annual revenue growth has historically exceeded 10%. Conversely, in industrial, communications, and consumer sectors, the median growth rate among private equity-backed companies did not meet these levels.6
This suggests that achieving similar returns as the past cycle is more challenging. However, top-quartile growth rates across all sectors surpassed these levels historically, and we believe these levels should continue to be achievable for GPs with strong fundamental value creation capabilities. This dynamic underscores the importance of meticulous asset selection in an environment that we believe will be characterized by greater returns dispersion.
Data science, AI, and automation continue to mature and accelerate, increasingly capable of driving revenue growth and enhancing efficiency. However, these initiatives can be capital expenditure-intensive, and we believe their success is contingent upon execution aligned with organizational dynamics and structures. Private equity is structurally set up to consider a longer-term perspective on growth initiatives and their associated costs, without the pressure of near-term earnings management. Therefore, private equity may be advantaged, relative to public markets, in its ability to potentially help portfolio companies harness the value created by the adoption of these tools. This dynamic may be especially prominent in the middle market, where opportunity may be more present for the private equity operating model to institutionalize the company’s operations.
Macro and valuation dynamics suggest to us that equity beta—across both public and private markets—is likely to decline relative to the prior cycle. This development elevates the importance of manager alpha as a critical third dimension of portfolio construction, alongside risk and return. Private equity, with its active ownership model and governance structure, may be particularly well-equipped to deliver on this dimension.
In the venture capital and growth equity ecosystem, we observe that valuations have normalized in many parts of the market. The universe of investors has also rationalized, especially in later investment stages (e.g., growth-equity), amid a challenging fundraising environment over the past three years. After excesses in the latter part of the 2010s and into 2020-2021, which saw more capital seeking investments than companies seeking capital,7 we see a more favorable buyer's market.
“Growth-at-all-costs” has been replaced by a focus on profitable growth, such that the median company is growing less quickly, but the largest companies are closer to profitability than they have been in several years.8 We see attractive opportunities for investors with dry powder (i.e., uncalled capital in active funds) to provide capital to category-leading companies that may previously have been out of reach due to elevated valuations in prior rounds. AI has rapidly evolved from ideation to application stage, significantly streamlining workflows through automation, content generation, and enhanced decision-making.
VC and growth equity exit paths have also been evolving. M&A is becoming a more common exit route, as companies stay private longer and additional private capital is used to fund higher growth trajectories. Overall, the long-term trend of companies wishing to stay private for longer continues. The size of these companies and the amount of capital they seek suggests growing demand for growth equity-scale, rather than venture-scale, funding rounds.
We believe careful manager selection will be key to unlocking attractive asymmetric risk-adjusted returns. An ability to source and identify attractive companies, the investment discipline to pace deployment appropriately, and operating expertise to help companies grow, scale, and eventually reach profitability will continue to be critical success factors, in our view.
Private Credit
Where are the pressure points?
An underwriting story
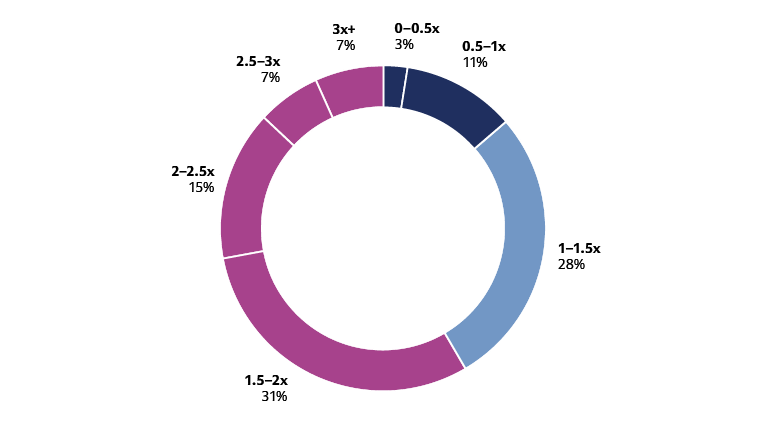
Defaults have been muted so far, supported by solid borrower fundamentals in aggregate and active refinancings that have extended maturities. The average coverage ratio (EBITDA/Interest Expense) has shown an upward trajectory over the past year. However, a segment of borrowers is exhibiting signs of strain, with approximately 15% of private credit borrowers currently not generating sufficient operating profit (EBITDA) to cover their interest payments.
Borrowers: A look under the hood
Source: Houlihan Lokey, as of June 30, 2025.
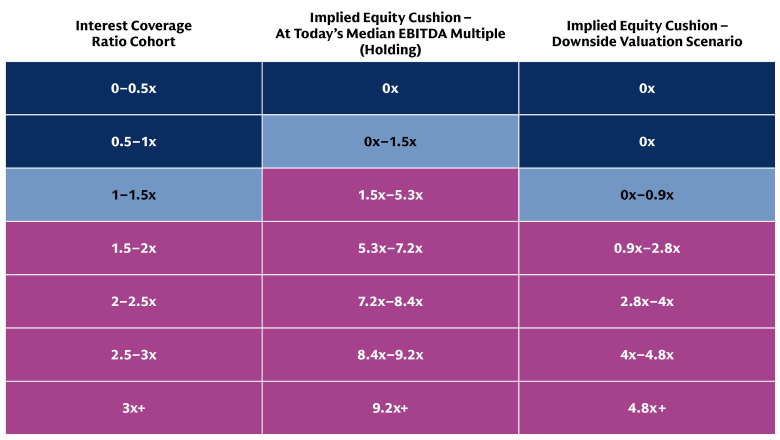
Source: Goldman Sachs Asset Management calculations. Assumes 3.13% base rate, 5.5% spread. 13x median holding multiple and 8.6x median exit multiple for the downside scenario (data courtesy of MSCI, as of 2Q 2025). These examples are for illustrative purposes only and are not actual results. If any assumptions used do not prove to be true, results may vary substantially.
Rate cuts can marginally alleviate stress for distressed borrowers, but we expect their overall impact to be limited. Our analysis indicates that a 1.25% rate cut would only restore the interest coverage ratio to 1.0x for borrowers currently at 0.88x or higher. For those with elevated but manageable interest expenses (1.0-1.5x interest coverage), some rate-based relief might help mitigate further deterioration and we believe may offer marginally more breathing room in case of temporary stumbles.
Companies currently struggling to service their debt have likely missed initial operational targets and will find solvency challenging without an operational pivot. In a default scenario, historical recovery rates in private credit have ranged around 65%,9 implying ultimate losses in the mid-single digits if the cohort of borrowers with interest coverage below 1.0x fail to meet their debt obligations.
Loans originated just before interest rates began to rise would have experienced the most significant impact from fundamental deterioration. For instance, when rates peaked at ~5% above pre-2022 levels, a loan underwritten at 5.5x EBITDA would have faced an additional 25-30 cents in interest payments for every $1 of EBITDA at underwriting.
Deals underwritten in the months preceding these rate increases had little opportunity for EBITDA growth to compensate. Some distressed borrowers may have delayed inevitable defaults through Payment-in-Kind (PIK) arrangements or refinancings, leveraging market liquidity. Approximately 10% of private credit loans include PIK provisions, with over half of these introduced post-underwriting, signaling fundamental deterioration.10 For these borrowers, the probability of default is elevated barring significant intervention.
What happens when loans mature?
For borrowers at the margin, or those in the "elevated but managed" category (25-30% of the market), the pressure point may emerge when loans mature or when the company is sold. The question then becomes whether there will be sufficient value to repay the full debt obligation and maintain enough enterprise value for the equity owner to avoid capitulation, especially if valuations decline from their underwriting environment.
In aggregate, underwriting provided an adequate equity cushion, as leverage levels (Debt/EBITDA) remained stable even with overall valuation growth. Our analysis suggests that for a company with stable fundamentals, a reset in the valuation environment should have minimal to no impact on its creditworthiness.
Borrowers with coverage ratios above 1.5x (representing 55-60% of the market) are estimated to possess enough equity cushion to meet their credit repayment obligations—even if equity valuations decrease from today’s median holding multiple to the lower-quartile exit multiple, a rather extreme spread of 4.5x EBITDA.
Outcomes for lenders to the "elevated but managed" borrowers may be most susceptible to equity valuation sensitivity. Companies with a 1x coverage ratio have approximately a 1.5x EBITDA cushion for valuation deterioration from today’s median holding multiple. Our math suggests this cohort of borrowers is likely to have leverage levels (Debt/EBITDA) above the levels at initial underwriting. Much of the implied “levering up” is due to EBITDA declines (typical base-case underwriting effectively assumes deleveraging over time through EBITDA growth). We believe companies in this situation with fundamentally sound businesses will likely need to be recapitalized with hybrid or equity capital to balance capital structures.
Outlook for new capital deployment
We believe private credit continues to present attractive value. Despite broad spread compression and an uptick in defaults, private credit still generates higher yields than public markets, with historically lower default rates compared to syndicated loans.11 Differentiation will increasingly depend on sourcing quality, underwriting standards, collateral monitoring, and creditor influence. Bottom-up underwriting, unconstrained by benchmark weights, offers a particular advantage in credit, especially as public indices are tilted towards market segments with more debt outstanding. The future direction of spreads will be determined by evolving supply and demand dynamics.
A more favorable M&A environment should stimulate greater demand for credit financing; however, as long as the supply of credit remains robust, spreads are expected to stay range-bound. A more robust M&A environment should also drive increased demand for mezzanine solutions. We expect PIK to continue to be a feature in underwriting, particularly in mezzanine. When prudently underwritten as an integral part of the capital structure from the loan's inception, we believe PIK can deliver attractive value. It can also serve as a potential mitigant against further spread compression, as the yield accumulates at the underwritten spread. Nevertheless, the risk profile of PIK deals, relative to cash-pay instruments, makes manager selection even more critical. In this environment, we view mezzanine as a potential alpha strategy, to be pursued with the appropriate investment partner.
As investors access the asset class through evergreen funds (i.e., perpetual funds), we believe they should recognize that they are acquiring a legacy portfolio, not solely a future portfolio, unlike with drawdown funds with a finite life. In evergreen funds, many loans originated in 2021 will likely remain on the books, with troubled ones persisting for longer. Consequently, selecting funds with less exposure to the 2021 vintage may serve as a risk-mitigating tactic.
While direct lending has garnered significant attention, we believe private credit encompasses a broad addressable market that has yet to be fully accessed. Some of the areas include:
- Direct lending in Asia is still in its early stages.
- Real estate credit is currently experiencing tailwinds similar to those that previously supported the expansion of corporate direct lending.
- Private asset-backed finance remains a relatively nascent market.
- Credit secondaries are offering new avenues for liquidity and diversification.
- Mezzanine may see increased demand as the M&A market recovers, driving the need for solutions in the middle of the capital structure.
Real Estate
Ready for a rebound?
After nearly three years of muted transaction activity, we believe real estate may finally be ready for a rebound. Cap rates rose in 2023 and 2024 alongside higher interest rates but levelled off in 2025, with the start of rate cuts across many markets and expectations for additional rate cuts.12 Rent growth has decelerated but remains positive in most sectors—with office a notable exception, albeit with dispersion—and we believe the outlook is improving.13 A drop in construction starts since 2022 bodes well for commercial real estate valuations, in our view, supporting rent growth and easing pressures brought on by an earlier glut of new supply in certain industrial and multifamily markets.
Transaction activity has picked up in 2025—fueled by liquid financing markets and the need of many fund managers to generate distributions—and is primed to accelerate at a time when dry powder is at its lowest point since 2020 due to multiple years of subdued fundraising. This presents potential opportunities for those willing to commit to the asset class.
While the backdrop broadly has improved, we believe there will be localized stress with continued dispersion across and within sectors, regions, and strategies. The “flight to quality” dynamic continues, with a clear bifurcation between prime assets (new, well-located, energy-efficient buildings with attractive amenities) and those assets lacking such features. Differences between these assets are observed across rent growth, occupancy, and liquidity.
Office remains the area under the most strain, with $57 billion of distressed assets in the US, representing nearly half of all distressed.14 However, this sector is seeing some of the most prominent dispersion discussed above. Investors are slowly starting to reenter the market, with a focus on prime assets; transaction activity for office assets in central business districts is up 54% year-to-date through 3Q—albeit from a depressed level.15 Going forward, the fate of the office sector may be closely tied to automation and AI themes—the extent to which these forces reshape and resize companies’ workforces will be a key factor.
Near-term maturities remain high in real estate, with over $850 billion due to be refinanced by year-end 2026.16 Extensions may need to be addressed, and in some cases, refinancings will force price discovery.
Infrastructure
Where are the opportunities beyond AI?
Digitization, particularly the rise of AI, has emerged as a central theme across infrastructure and real assets. While opportunities persist in this domain, valuations remain elevated, with digital assets exhibiting a median EV/EBITDA multiple of 11.7x, compared to 10.2x for the broader infrastructure universe.17 We believe data assets developed without pre-existing tenant contracts face significant adoption risk.
After an era of flat power demand, we now see growing demand for energy solutions to power AI and digitization initiatives. In many parts of the world, the current power grid baseload capacity is insufficient to support projected demand growth, and assets themselves are aging. In the US, assets in the power grid infrastructure average 40 years old—making for a structural mismatch to the rapidly-advancing technologies underpinning AI.18 In Europe, potential data center power demand makes up around 90% of the EU28's power demand; even 20% conversion of the potential to actual demand would represent a material change from the declining energy consumption rates in Europe of the past 15 years.19 Estimates indicate $12 trillion in capital demand for energy transition by 2030.20 Demand is expected to continue growing even if power usage per AI server falls over time due to improved efficiencies.21
We believe this demand will need to be addressed through a wide variety of energy sources, both traditional and sustainable, with a focus on distributed generation solutions, reliable and dispatchable supply, and demand flexibility. In an environment of aging infrastructure and more instances of extreme weather events, investments in the power grids will be required to improve the grid’s resiliency; assets that improve energy efficiency, reducing consumption intensity will become a priority. The physical nature of these assets and the costs of bringing energy solutions online mean significant demand for capital solutions. In some cases, the capital required makes these assets the purview of value-add/opportunistic, rather than core strategies.
Beyond AI and data centers, we see compelling opportunities in various themes that may currently be overlooked and that may have more attractive supply/demand characteristics. The circular economy, encompassing waste, water, and recycling, involves contracted, essential services largely insulated from macroeconomic fluctuations. These opportunities are often found in the relatively undercapitalized middle market, contrasting with the mega-cap space where most investor capital is concentrated. Transportation and logistics are undergoing transformation as supply chains reorient. Countries globally are realigning trade routes to prioritize supply chain resilience and geopolitical alignment over mere cost efficiency. In the US, we have observed a drive for onshoring and increased domestic production that has led to a resurgence in rail demand and evolving requirements across seaports, airports, and storage. This trend is expected to continue, as we anticipate domestic manufacturing to accelerate over the next decade.
In Europe, the opportunity landscape is evolving, supported by broad policy initiatives and an intensified focus on energy independence. However, we believe investors must acknowledge significant differences in regulations, permitting, and underlying growth across economies. Some of Europe’s larger economies, such as France, are experiencing slower growth, while others, particularly in Southern Europe like Spain, are expanding more rapidly. Broad policy changes across Europe, including the Clean Industrial Deal signed in February, are expected to be beneficial. Nevertheless, country-specific policies are also crucial; Germany, for instance, is likely to offer numerous opportunities following a substantial infrastructure spending bill passed in September. Broadly, large-cap assets trade at a 13.1x EV/EBITDA multiple, whereas middle-market assets trade at 11.2x,22 making for—in our view—a more attractive opportunity set in the middle market.
1 MSCI Private Assets. As of 2Q 2025.
2 EY Prive Equity Pulse Survey conducted by AlphaSights. Data as of June 30, 2025.
3 Goldman Sachs Global Investment Research. As of October 8, 2025.
4 Goldman Sachs Global Banking and Markets. As of October 24, 2025.
5 Goldman Sachs Asset Management. This is based on an updated 2023 value creation framework considering current valuations and cost of capital. Assumes targeted returns of 2.5x gross TVPI (Total Value to Paid-In), or roughly 2.0x net. Historically, margin expansion contributed just under 10% of the average value-add for private equity-backed companies, implying a required revenue growth closer to 9–10% to achieve typical return levels targeted by investors private equity managers; this target surpasses historical experience (7–9%).EBITA refers to earnings before interest, taxes, depreciation, and amortization.
6 MSCI Private Assets, as of 2Q 2025.
7 Pitchbook, as of June 30, 2025
8 Silicon Valley Bank, State Of The Market, 1H 2025
9 S&P Global, 5-year average trailing recovery rates. As of September 2025
10 Lincoln International as of 4Q 2024.
11 Cliffwater Direct Lending Index, PitchBook LCD, data through March 25, 2025. Data include repricings and extensions done via amendment process only.
12 Goldman Sachs Global Investment Research. As of October 2025.
13 MSCI RCA. As of 3Q 2025.
14 MSCI RCA. As of October 2025.
15 MSCI RCA. As of 3Q 2025.
16 MSCI RCA. As of October 2025.
17 EDHEC. As of October 2025. Enterprise Value to Earnings Before Interest, Taxes, Depreciation, and Amortization.
18 Goldman Sachs, “Powering the AI Era.” July 2025.
19 Goldman Sachs Global Investment Research: ‘Powering Up Europe: AI, data centers and energy needs: at Europe's inflection.” October 2025.
20 Goldman Sachs, “Powering the AI Era.” July 2025. Estimates based on Goldman Sachs Global Investment Research reports: “Carbonomics: the GS net zero carbon scenarios – a reality check”; “Generational growth: AI, data centers and the coming US power demand surge”; Power & utilities figure globalized based on a US estimate of ~$1.4T.
21 Goldman Sachs Global Investment Research: AI/Data Center Power Demand: The 6 Ps driving growth and constraints. October 2025.
22 EDHEC. As of October 2025.