Corporate Pension Monthly

Steady State
In June, our estimate of the aggregate corporate defined benefit (DB) funded status was 110.0%, in line with our estimate of 110.1% in May. Sticky inflation and resilient consumer spending data in the US have pushed out the Federal Reserve’s interest rate cut timeline, opening the possibility that the next move may be higher as opposed to lower. At the same time, a technology-led global equity market sell-off dragged asset performance lower. On the other hand, bond markets outperformed equities on the back of easing geopolitical tension and cooling oil prices. Consequently, impacts to asset and liability estimates offset each other to keep our estimated funded status largely unchanged over the month.
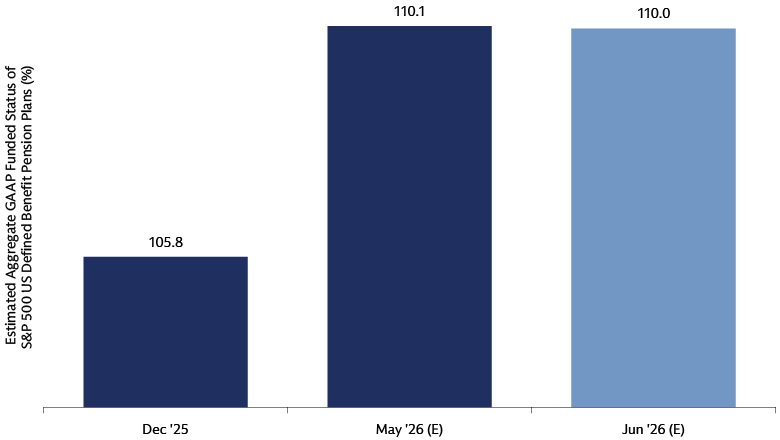
Chart source: MSCI, Bloomberg, and Goldman Sachs Asset Management as of June 2026. Generally Accepted Accounting Principles (GAAP) funded status based on US plans (when specified) of S&P 500 companies (i.e., 229 companies with pension data per GS Asset Management research). Past performance does not predict future returns and does not guarantee future results, which may vary. The funded status figures are estimated and unaudited as of June 30, 2026, and subject to potentially significant revisions over time. Actual returns may vary significantly. The economic and market forecasts presented herein have been generated by Goldman Sachs Asset Management for informational purposes as of the date of this presentation. They are based on proprietary models and there can be no assurance that the forecasts will be achieved. Please see additional disclosures at the end of this presentation.
Source: MSCI, Bloomberg, and Goldman Sachs Asset Management. As of June 30, 2026. Past performance does not predict future returns and does not guarantee future results, which may vary.
Recent Matters of Note
On June 15, the Pension Benefit Guaranty Corporation (PBGC) issued its first opinion letter in 24 years to reassert its longstanding position that the agency does not guarantee pension benefits once the plans are transferred to an insurance company. By the same token, the insurance company is not required to pay premiums to the PBGC.
The letter also clarified that annuity buyouts for employees who remain employed do not trigger a reportable “active participant reduction” event, as these transactions reduce rather than increase PBGC risk. For reference, such events are typically triggered by workforce-driven actions like reorganization, mass layoffs, and employee attrition that reduce active participants in the plan by 80%.
Source: Company 10-K filings and news releases as of June 2026. Any reference to a specific company or security does not constitute a recommendation to buy, sell, hold or directly invest in the company or its securities. For illustrative purposes only. Please see additional disclosures at the end of this document. There is no guarantee that objectives will be met.
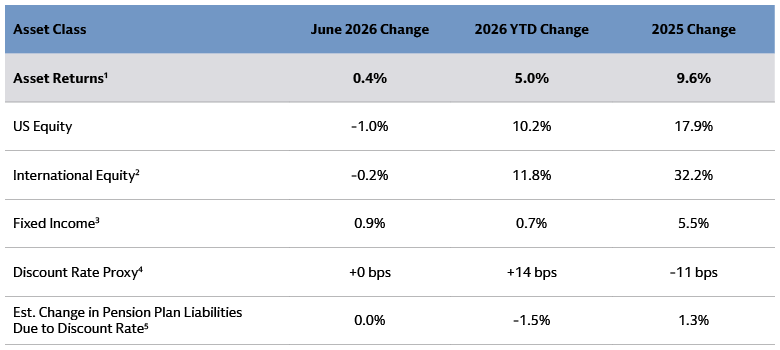
1 Asset return: Average asset-weighted return of S&P 500 companies’ US plans (when specified). US Equity uses S&P 500 Index.
2 Mix of MSCI EAFE and MSCI ACWI ex-US.
3 Mix of Corporates (Bloomberg US Aggregate Bond), High Yield (Bloomberg US High Yield), Treasuries (Bloomberg 20+ Year Treasuries), and Long Credit (Bloomberg Long US Credit).
4 Discount rate proxy measured by 50% Moody’s AA Corporate Bond and 50% US Long Duration Corporate Bond.
5 Estimated Change in Plan Liabilities based on increase in estimated discount rate and duration of 12. For 2025, uses average change in discount rate change for December year-end filers.
6 Based upon the 50 largest US (when specified) defined benefit plans of S&P 500 companies by US plan assets. For illustrative purposes only.
