Staying Active Amid Complexity in 2026

Key Takeaways
This article is part of our Investment Outlook 2026: Seeking Catalysts Amid Complexity
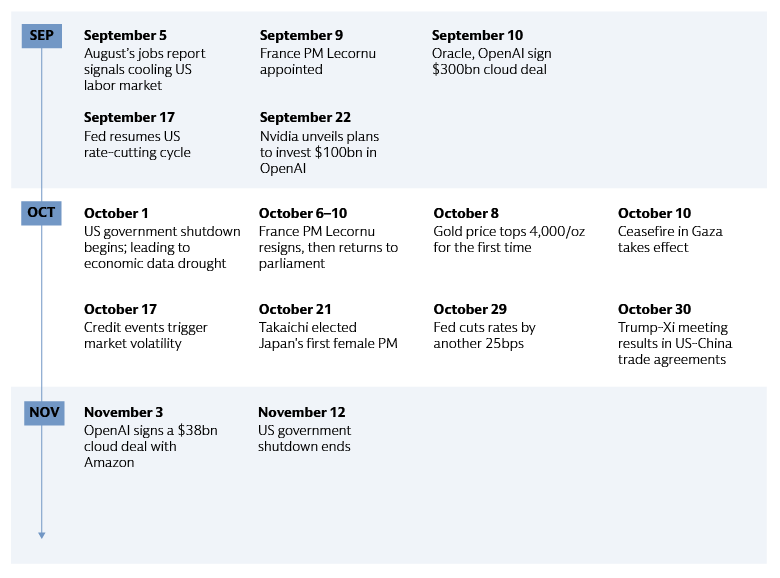
Source: Goldman Sachs Asset Management. As of November 18, 2025. This timeline is provided for general informational purposes only and is not intended to be a comprehensive analysis of all market drivers or events.
Navigating Complexity
Multiple factors could impact economic conditions and financial markets in 2026, making it challenging to predict a clear direction. We believe active investment management is well-suited for navigating such conditions. Below, we explore a complex backdrop of central bank paths, tariffs, and fiscal dynamics, and share our observations on equity market concentration, credit events, and geopolitics.
Figures in Focus
- 9/10
- CountriesIn the G10 cut rates in 2025
- 18%
- US effective tariff rateThe highest consumers have faced since 1934
- $100+
- TrillionTotal amount of global government debt
Sources: (Left) US Federal Reserve, ECB, Bank of Japan. As of October 14. 2025. (Center) Budget Lab Yale University, Goldman Sachs Global Investment Research. As of October 12, 2025. (Right) OECD, Reuters. As of March 20, 2025.
Central bank paths
We believe the labor market holds the key to the pace and scale of Fed easing into 2026, so long as inflation remains anchored. If labor market weakness persists, driven by immigration restrictions, federal layoffs, and labor-saving AI, additional Fed rate cuts may follow, especially if tariff-induced inflation is short-lived. We expect the ECB to maintain its 2% rate, given at-target inflation and German fiscal expansion, though we do not rule out a return to rate cuts if inflation begins to moderate. In the UK, we believe easing inflation, a softening labor market, and fiscal contraction support further easing. Disinflation, Fed cuts, and signs of further dollar weakness could lead to further easing in emerging markets, with country variations. Japan remains on track towards a higher rate regime, in our view, backed by firm inflation, strong GDP growth, and potential fiscal easing. With policy rates becoming less restrictive and no tariff-induced recession, rate hikes in other economies are also possible, signaling a new phase in global monetary policy.
A new trade order
US trade deals with the UK, EU and Japan have provided some stabilization after April’s tariff shock. India and the US appear to be closing in on a trade deal.1 The US and China have made progress on tariffs and rare earth controls following the Trump-Xi meeting in South Korea. However, there is potential for an escalation in tensions. The geopolitical dynamics driving the decoupling of the world’s two largest economies continue to outweigh those that favor tighter integration between them. Beyond specific trade deals, the market has broadly anticipated tariffs causing a one-off shift in prices so far, rather than a sustained threat. Proactive tariff mitigation strategies, including supply chain adjustments and selective price increases, have enabled most companies to protect margins so far. As tariffs settle at lower (but not low) levels than initially seemed likely, we believe they still present downside risk to growth in 2026, especially if greater pass-through of tariff costs to consumer prices becomes evident in the coming months.
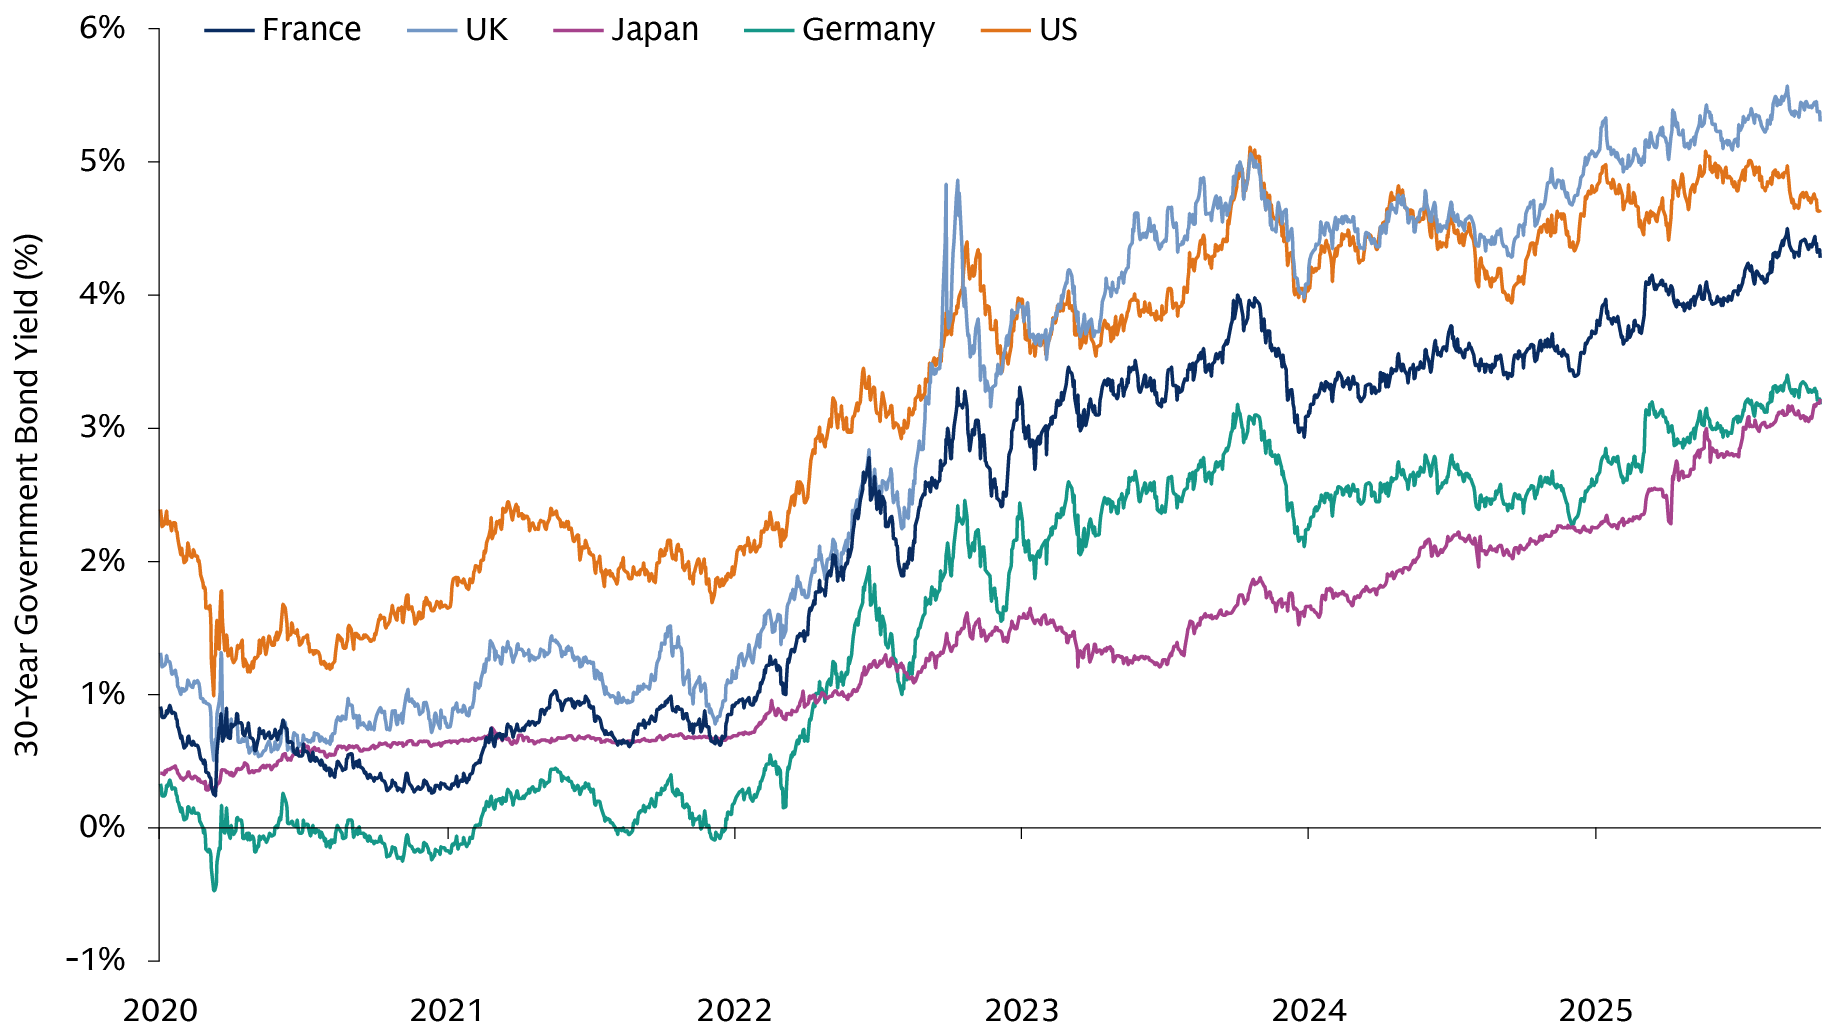
Deficits and debt
Pinpointing the exact moment when fiscal anxieties will emerge or peak is impossible, but a deep understanding of the landscape is essential. The US fiscal deficit is unusually large relative to the economy's strength, with the debt-to-GDP ratio approaching a post-war high and higher real rates steepening the path of interest expenses. Elsewhere, persistent political instability in France has created a fragmented parliament, making meaningful fiscal reform difficult. This has sharpened investor focus on France's deteriorating fiscal outlook ahead of the 2027 presidential elections, with 10-year French government bond yields now matching those in Italy. Across markets, spending pressures are also mounting. These include higher defense outlays, the climate transition, and rising healthcare and pension costs due to demographic aging.
Figures in Focus
- $1+
- TrillionMarket capitalization for 9 stocks in the S&P 500
- $360
- BillionPrivate equity and credit loans across 7 large US banks, representing ~11% of their total loans
- Nov 3
- VotingUS midterm elections in 2026
Sources: (Left) S&P Global Ratings. As of November 11, 2025. (Center) Institute of International Finance (IIF) Global Debt Monitor, as of September 2025. Government debt data as of June 2025. Federal Financial Institutions Examination Council. Company data, Goldman Sachs Global Investment Research. As of October 19, 2025. Data as of 2Q 2025. We believe private equity loans are largely capital call facilities and other subscription-based facilities, private credit loans are largely to direct lenders / business development companies / marketplace lenders.
Market concentration
The top 10 US companies represent ~40% of S&P 500’s market cap.2 Although market concentration is high, we observe that similar cycles of industry dominance in finance or energy lasted for decades without necessarily culminating in crisis. US technology stock valuations have risen amid investor enthusiasm for AI, but we believe price appreciation primarily stems from fundamental growth and strong balance sheets, not irrational exuberance. The primary risk lies in earnings disappointment, in our view, which could challenge the sustainability of returns. In the equity market, we seek to identify companies exhibiting high gross margins, fortress balance sheets, and durable end markets. Further down the market capitalization spectrum—in the small and mid-cap space—we see potential opportunities among enablers, so-called "picks and shovels” of the AI boom. While AI capex has largely been internally financed to date, the increasing reliance on debt warrants close monitoring in 2026.
Credit events
Recent bankruptcies have intensified scrutiny on the exposure of US banks to Non-Deposit Financial Institutions (NDFIs).3 The events have also raised broader concerns about the overall health and resilience of the banking sector, and heightened sensitivity to credit quality and interconnectedness within the financial system. We view recent issues as idiosyncratic rather than indicative of rising systemic credit risk across public and private credit markets. Nonetheless, they reinforce the importance of active security selection in public markets and rigorous underwriting and surveillance in private credit. In our view, resilient US corporate credit metrics suggest the market is mid-cycle, not late-cycle. In private credit, we believe overall borrower fundamentals remain healthy, in aggregate.
Geopolitics, US midterms, and Fed leadership
Despite recent steps closer to peace in the Middle East, geopolitical risks remain high. Russia and Ukraine remain far apart on their key demands for ending the war. Drone incursions into Poland’s airspace underscore the risk of escalation beyond Ukraine. Market responses to geopolitical events were muted in 2025, but energy supplies, demand, and prices remain vulnerable to volatility. The US midterms in November 2026 may influence market sentiment, with potential impacts on equities, rates, and the US dollar. Ongoing pressure from the White House on the Fed to reduce rates could unsettle markets, lift inflation expectations, steepen the curve, and weigh on the dollar. Fed Chair Powell’s term ends in May, but announcements on a potential new Chair nominee could come sooner.
Seeking Catalysts
As we explore potential opportunities in 2026, we see catalysts as drivers, events or secular themes that have the potential to accelerate growth and unlock value within well-aligned investment portfolios. We explore easing cycles, AI capex, dealmaking below, and also consider potential implications of US deregulation, a heightened focus among nations on economic security and rising power demand.
Figures in Focus
- 12%
- US small cap outperformance vs S&P 500 after end of last five rate-cutting cycles
- 27%
- Of S&P 500 capex is from 5 firmsAmount of S&P 500 capex that comes from the five largest AI hyperscalers
- 15%+
- US M&A momentumExpected increase in the number of completed US M&A deals in 2026.
Sources: (Left) Goldman Sachs Asset Management, FactSet. As of March 2020. Average forward-year returns for Russell 2000 following the end of the last 5 rate-cutting cycles: January 1996, November 1998, June 2003, December 2008, March 2020. (Center) Goldman Sachs Global Investment Research. As of October 16, 2025. Hyperscalers include Amazon, Google, Meta, Microsoft and Oracle. (Right) Goldman Sachs Global Investment Research. As of September 2025.
Easing cycles
We believe easing cycles present opportunities across asset classes. Rate cuts could benefit fixed income, including front-end US Treasuries, and investment-grade credit, where the rate component of yields is higher than in the past, meaning total returns benefit from falling rates. Easing cycles also represent a potential tailwind for rate-sensitive asset classes, like small-cap stocks, and commercial real estate. Emerging market local bonds and external debt also stand to benefit, in our view, as Fed easing enables emerging market rate cuts without significant currency weakness. Leveraged loans, being floating-rate, may see underlying issuers benefit from lower interest burdens, improving interest coverage. From a currency perspective, US dollar performance has been mixed amid Fed cutting cycles. That said, historically, the dollar tends to rally, or move sideways, if the Fed cuts rates and no recession follows.
AI capex and innovation
Mega-cap AI capex spending continues to exceed expectations. We believe hyperscalers’ AI capex will remain durable into 2026. Analysts have underestimated AI capex every quarter for the past two years,4 suggesting a continued upside risk to the broader AI trade’s durability heading into year-end. Meanwhile, AI is transforming the technology sector, driving unprecedented growth in the semiconductor space, software through agentic AI, data management, cybersecurity and fintech. In the public equity market, while early GenAI enthusiasm was concentrated in a narrow group of stocks, we see compelling reasons for the investment landscape to broaden, unlocking new opportunities for emerging innovators. Although companies continue to deploy AI internally and externally, return on investment visibility remains low. We believe this heightens the importance of conducting rigorous analysis of business fundamentals.
Dealmaking revival
Global dealmaking activity shows signs of a strong recovery, which we believe could extend into 2026.5 In the US, M&A significantly increased in 2025 compared to 2024, and the equity market saw a healthy number of IPOs. Leading indicators suggest this positive trend for dealmaking will continue. Similarly, European M&A activity has rebounded, with announced deals over the past year exceeding historical averages. We believe greater dealmaking could spur a more widespread resumption of private equity activity and catalyze more demand for private credit financing, including demand for mezzanine solutions. A pickup in M&A may also draw greater interest to smaller companies, which form the backbone of activity. A decline in interest rates may further spur dealmaking, with smaller companies increasingly becoming bid targets as firms seek bolt-on acquisitions or industry consolidation plays.
Figures in Focus
- $3.4
- TrillionAmount OBBBA could add to US budget deficit over the next decade.
- 5%
- of GDPDefense spending commitment by NATO members by 2035.
- 175%
- Power demand growthForecasted from data centers by 2030 vs 2023.
Sources: (Left) $3.5 trillion estimate refers to net increase in unified budget deficit over the 2025-2034 period. Congressional Budget Office. As of July 21, 2025. (Center) North Atlantic Treaty Organization (NATO). As of August 27, 2025. (Right) Goldman Sachs Global Investment Research. As of October 13, 2025.
US tax cuts and deregulation
We expect the interplay between US tax policy, tariff revenue allocation, and deregulation to influence the investment backdrop in 2026. US tax cuts are unlikely to materialize until the Spring 2026 tax season, in our view. We estimate that the cost of tax cuts featured in the One Big Beautiful Bill Act (OBBBA) and tariff revenues largely balance each other out in the short term, leaving the fiscal deficit little changed to modestly lower. The Trump administration is also pursuing an economic policy focused on deregulation, presenting potential catalysts for sectors including financials, energy, and pharma. As Congress turns its focus to the midterms, we expect the regulatory agenda to become a bigger focus among policymakers and investors.
Economic security
After a year dominated by tariff headlines, we expect the theme of economic security will be prominent in 2026, catalyzing large-scale capital deployment into defense, energy, and infrastructure across developed markets. Europe’s defense sector, for instance, has transitioned from a sluggish, undervalued market to a central focus of government policy and one of the region’s fastest-growing sectors. We expect the implementation of Germany’s fiscal package to be a key focus area. Relative to Germany’s 2024 budget, spending could increase by more than €80bn (1.8% of GDP) in 2026.6 Key areas also receiving investment include a wide range of infrastructure and energy projects. We believe active managers are positioned to identify companies in the US and Europe that are poised for significant growth by providing solutions for resource security, supply chain resilience, energy independence, and national defense.
Power demand
We continue to expect data demand—driven in part by AI and in part from growth in non-AI data demand—will catalyze generational growth in global power demand. This backdrop necessitates a holistic investment approach, including low-carbon power generation, global transport electrification, and crucial grid enhancements in both emerging and developed markets. As technology companies and hyperscalers race to deploy AI, speed to power is also paramount. Credit financing for sustainable power generation, sustainable private credit, infrastructure and green bonds present potential opportunities, in our view. The US and European power industries also face a critical demographic dilemma: over 750,000 new workers are needed by 2030 amid an aging workforce and limited skilled labor. Access to talent and labor is set to become a key competitive advantage for companies.7
Key Questions
1. Where do I invest when everything looks expensive?
Key equity indices repeatedly set new all-time highs in 2025, including the S&P 500 in the US, Europe’s STOXX 600, and Japan’s Nikkei 225.8 In fixed income, spreads continue to hover around historically tight levels. When traditional investments appear expensive, a strategic approach beyond simply following benchmarks is crucial. We believe investors should consider actively managing their portfolio's mix of equities, bonds—and the securities underlying each allocation—and tilt portfolios to adapt to market conditions. While valuations across equity markets are elevated, we believe US equity returns were driven less by valuation expansion and more by earnings in recent quarters. In our view, small-cap valuations are attractive given the outlook for earnings, though a nuanced investment approach is required due to market inefficiencies and idiosyncratic risks. We see pockets of value in fixed income, including high yield and securitized credit, which may offer attractive income. Diversification—internationally and across asset classes—is also key, including exploring alternatives such as private markets, and hedge funds, which can potentially offer enhanced risk-adjusted returns. A combination of real assets, like infrastructure and real estate may improve overall portfolio performance. Shifting asset correlations and dollar dynamics make strategic FX hedging a key consideration.
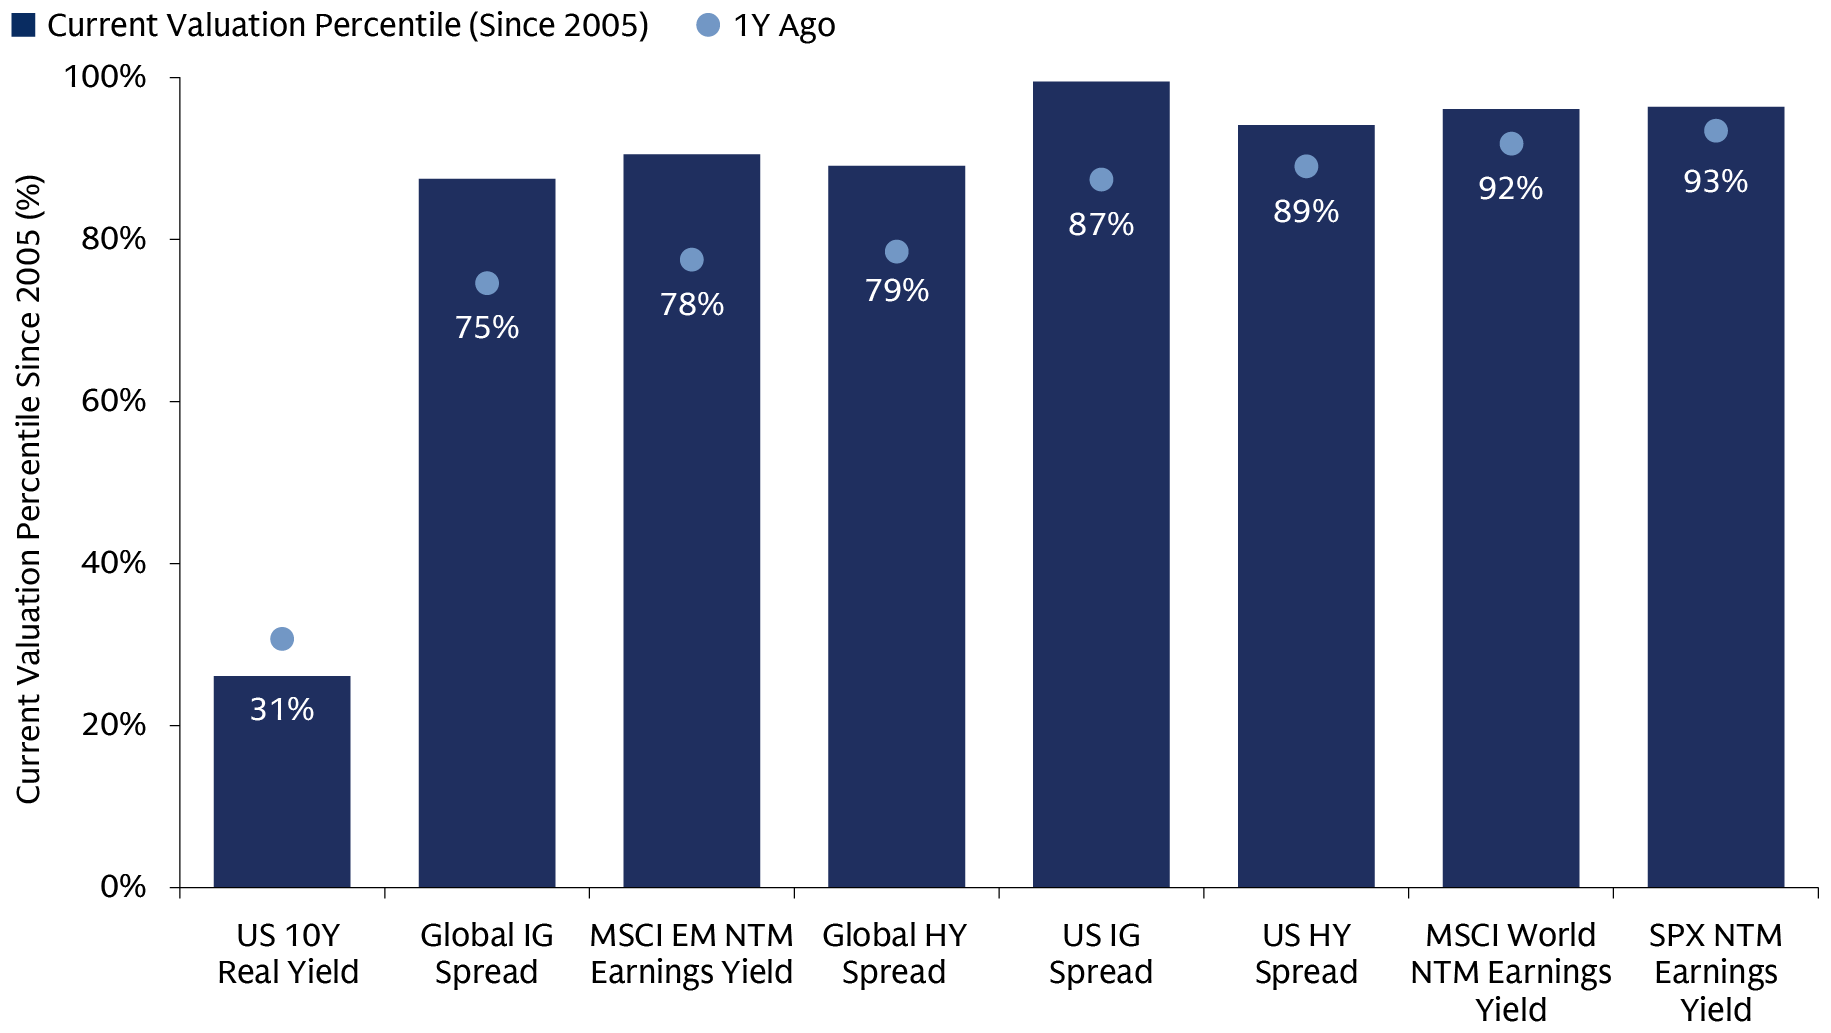
Sources: MSCI, Goldman Sachs Asset Management. As of October 24, 2025. Valuation percentiles are since 2005 as MSCI EM forward P/E data starts from 2005. Past performance does not guarantee future results, which may vary.
2. What are the potential investment implications from central bank actions in 2026?
Central bank actions provide fixed income investors with potential opportunities to express views in different sovereigns across the curve and diversify their duration exposures. In the US, we believe the Fed may cut rates twice in 2026, given its stance on labor market weakness. In Europe, resilience in the European economy and a hawkish ECB reaction function point to an extended pause in the easing cycle. However, the market may be underestimating the probability of easing resuming if inflation undershoots target. In the UK, the Bank of England could resume cuts in December, driven by improved inflation, a relatively weak labor market, and potential tax hikes. The Bank of Japan is likely to hike rates, in our view, due to high inflation and robust growth. We believe other G10 easing cycles vary: Sweden's may conclude and Norway's easing pace will likely continue. A Swiss return to negative rates is unlikely. Australia's cuts could pause, and New Zealand's rates may fall further. Emerging markets anticipate continued easing, supported by a subdued US dollar and lower oil prices.
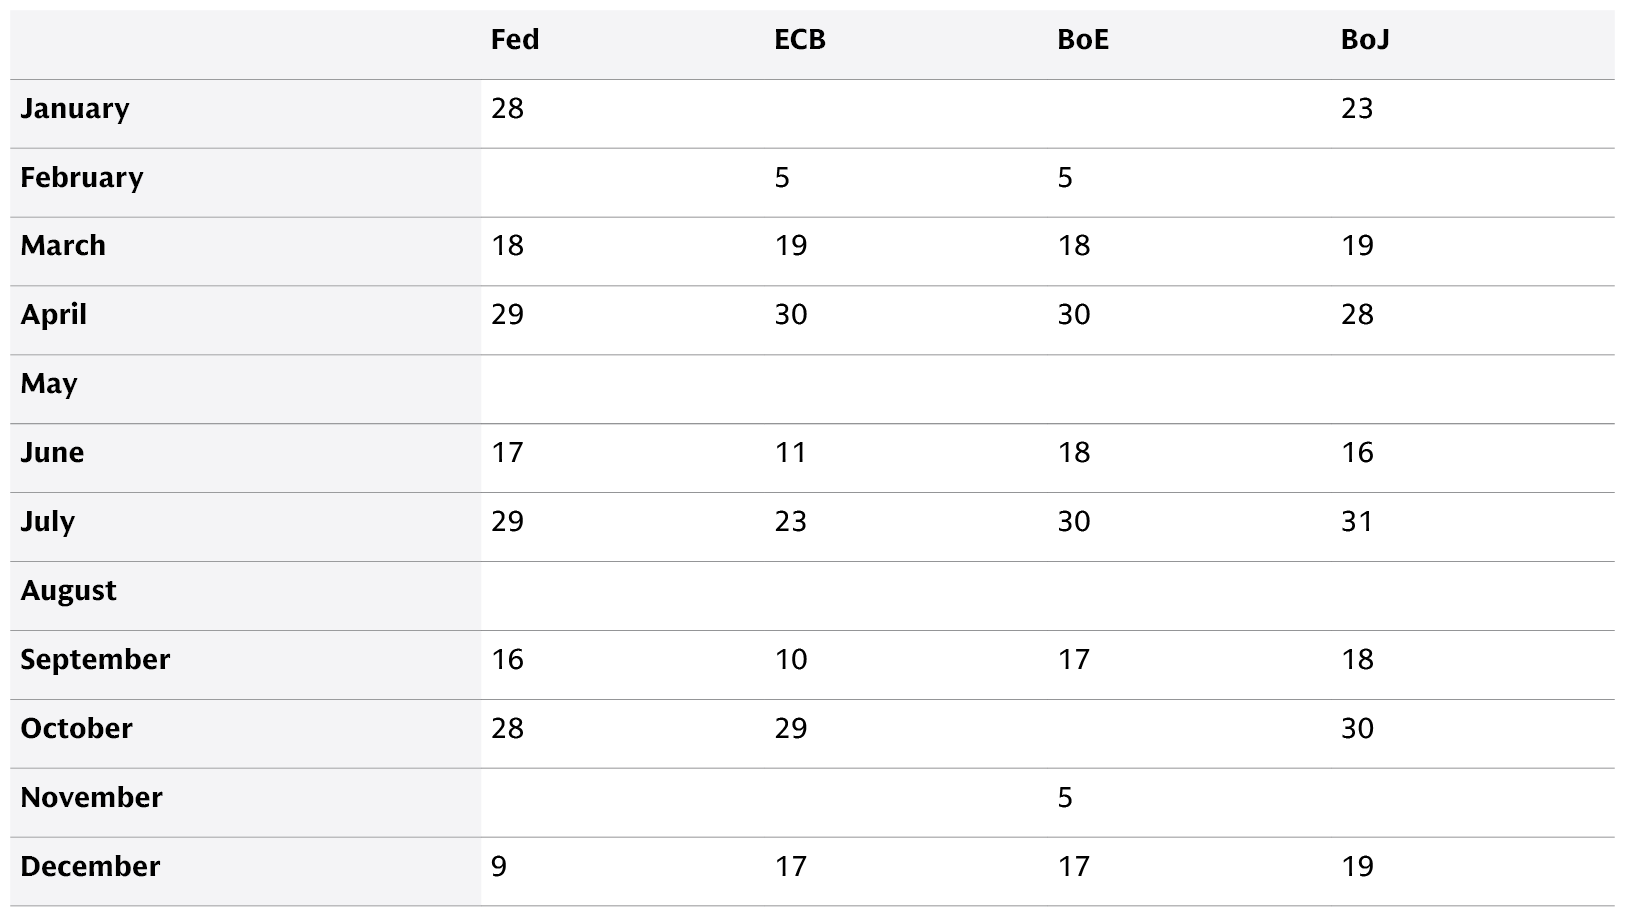
Sources: Fed, European Central Bank (ECB), Bank of England (BoE), Bank of Japan (BoJ). Latest scheduled meeting calendars. As of October 20, 2025.
3. How could consumer spending be impacted by tariffs?
US consumer confidence, while generally robust, shows emerging signs of weakness among lower-income households. However, this demographic has a limited impact on overall spending, as the wealthiest 20% of households account for 40% of total consumption, while lower-income groups spend less than 10%. Despite this, consumer spending increasingly prioritizes value, price, choice, and convenience. If tariff cost pass-through was merely delayed in 2025, a period of more moderate spending could follow in 2026. Nevertheless, strong household balance sheets, high savings rates, and accumulated wealth are expected to buffer spending. Anticipated Fed easing and US fiscal stimulus also suggest a sharp slowdown is unlikely. A critical factor will be the extent to which companies can pass on tariff costs, which may be challenging given potential labor market weakness and rising unemployment. Although US auto and credit card loan delinquencies have increased, particularly among subprime consumers, this is primarily attributed to "credit score migration effects" from the pandemic and larger auto loan sizes, rather than widespread household credit stress.
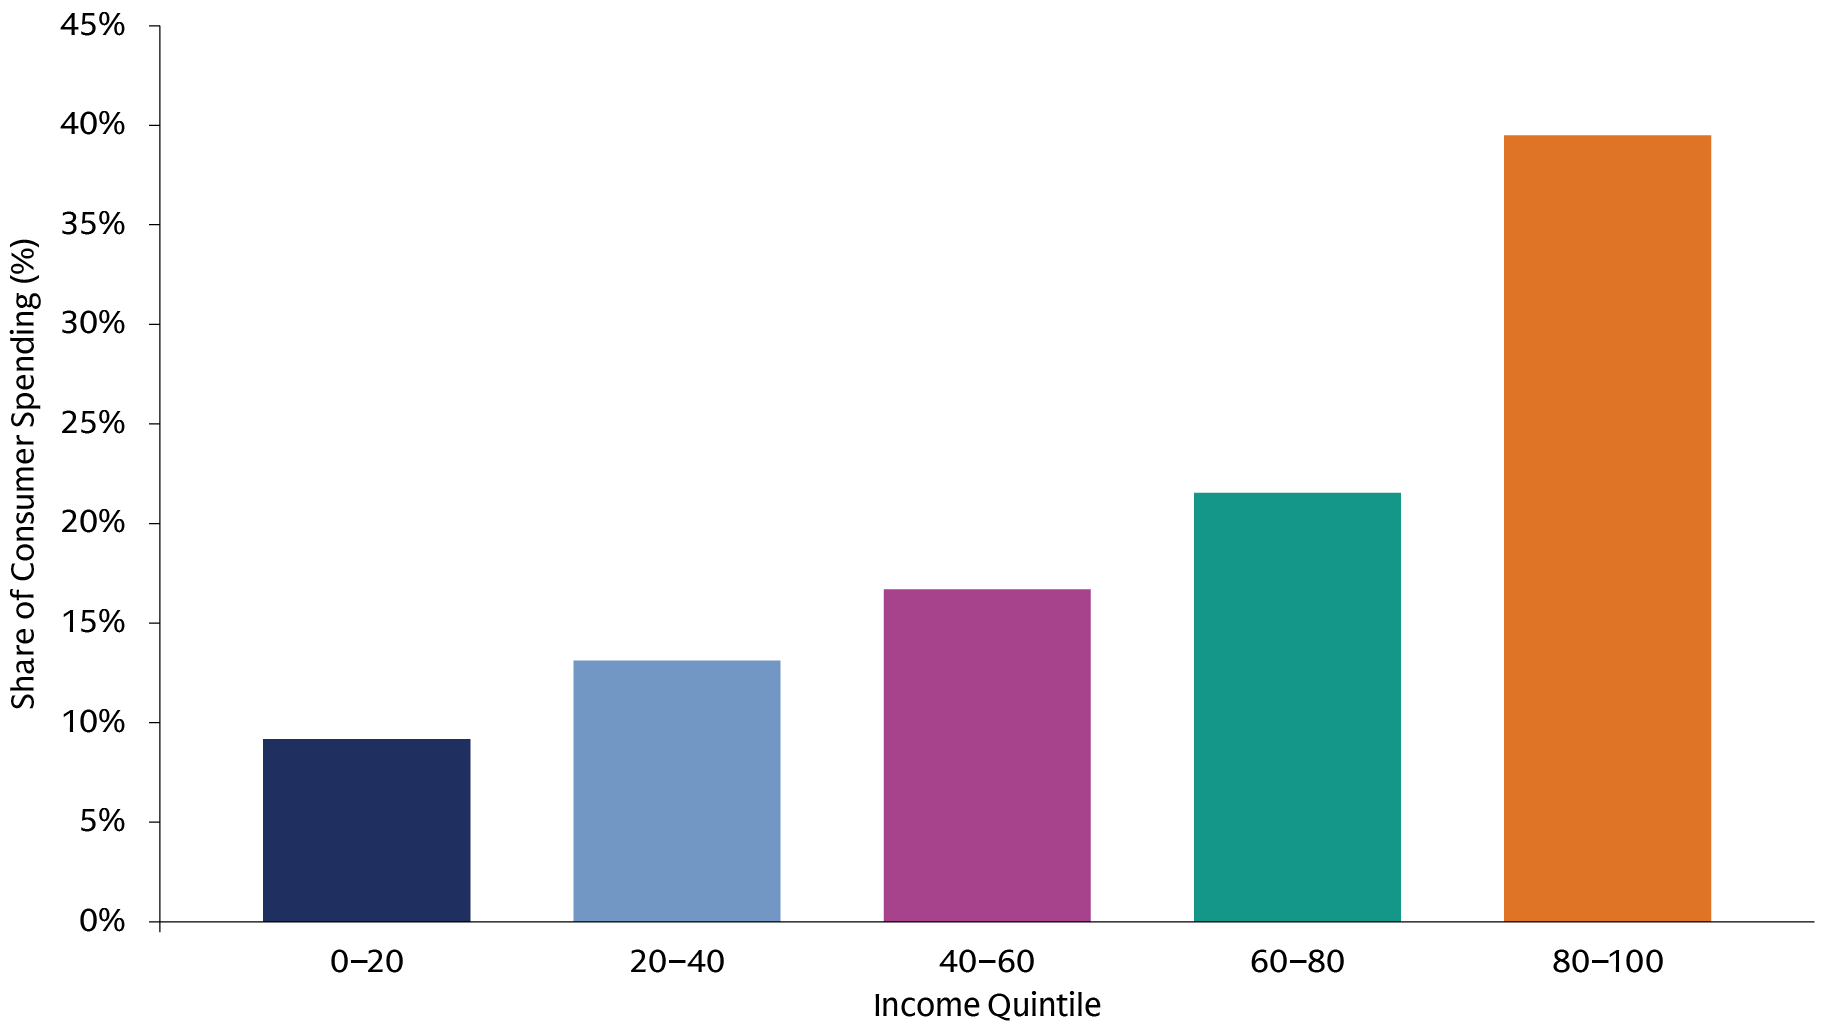
Sources: Bureau of Labor Statistics, Macrobond. Data from 2023. Historical analysis indicates that the underlying shares of expenditure have remained relatively stable over time.
4. Is fiscal friction here to stay for government bond investors?
For investors in government bonds, we believe the fiscal backdrop is a critical concern that could trigger significant market volatility. We believe government bonds can still mitigate downside growth risks, especially in an era of positive real yields. Recent years have seen bonds rally during periods of economic uncertainty. This occurred during the regional banking crisis in March 2023, in response to weak labor market data in 2024 and 2025, as well as during periods of heightened geopolitical risk. However, in our view, investors must dynamically adjust their allocation between risk assets and government bonds. The correlation between bonds and risk assets can shift from negative to positive, especially if inflation or fiscal concerns intensify, potentially diminishing bonds' hedging effectiveness. Front-end yields are more sensitive to central bank policy and have tended to offer strong counter-cyclical properties, acting as a hedge during economic weakening. Conversely, long-end yields are more susceptible to fiscal concerns and inflation expectations, which can drive them higher, leading to curve steepening. Understanding these dynamics also allows investors to exploit yield curve views which seek to optimize their portfolio's defensive characteristics.
Sources: Goldman Sachs Asset Management, Macrobond. As of October 15, 2025. Past performance does not guarantee future results, which may vary.
5. What policy proof points in Europe should investors monitor?
Across Europe, stimulus is already driving a capex revival. Companies that have underinvested for two decades are making renewed investment in capital-intensive sectors—driven by energy transition and security, defense, reshoring, infrastructure upgrades, digitalization, and AI. After a period of weak growth post-pandemic, higher government spending on infrastructure and defense is forecast to boost German GDP growth to 1.4% in 2026 and 1.8% the following year. We believe investors should monitor the speed and execution of Germany’s fiscal package in 2026, given its recent track record of underdelivering on budgeted investments. With Germany’s 2025 budget and the infrastructure fund law passed in late September, spending may pick up meaningfully in 2026 in areas such as defense. Even if the implementation of higher defense spending is gradual and complex, we believe it represents a potentially significant medium-term boost for growth. Germany is also reviewing government functions for efficiency, utilizing AI and digitalization. In our view, a reliance on global trade, high energy prices, and too much red tape remain growth headwinds.
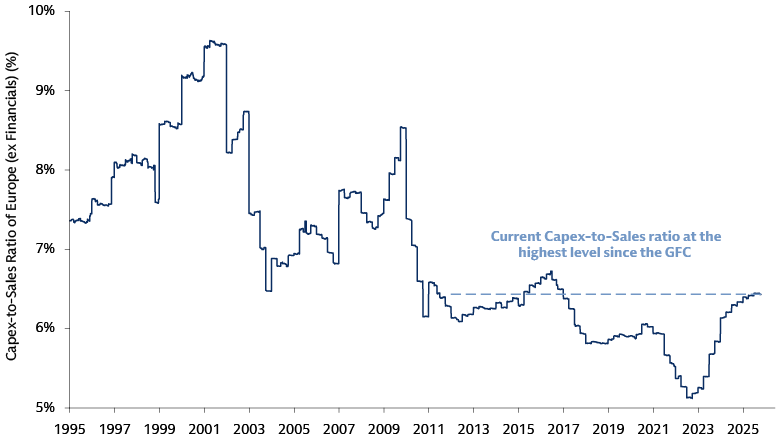
Sources: Goldman Sachs Global Investment Research. Datastream. As of October 23, 2025. Global Financial Crisis (GFC).
6. What factors could cause differentiation among the Magnificent 7 in the context of AI capex?
The size and speed of recent AI investment announcements among hyperscalers have raised questions around the sustainability of AI capex. In our view, we are closer to the early innings of AI capex and expect increased AI competition between hyperscalers and countries to drive spending globally. This includes markets that offer a combination of capital and power generation capabilities, including the Middle East and Asia. We believe differentiation among the Mag 7 companies, despite the durable AI capex, will be primarily driven by two critical factors. Firstly, it depends on whether a company's AI investment is motivated by the pursuit of new markets or by the strategic desire to enhance an already existing market-leading position. Secondly, differentiation will hinge on whether these companies possess access to competitive, proprietary AI technology, or if they will need to forge durable partnerships with model builders to sustain their competitive edge. More broadly, as fundamental investors, we believe it is crucial that core businesses remain robust, particularly as companies aggressively invest in AI technology. Beyond the Mag 7, enterprise adoption is broadening, driving efforts to clean, structure, and secure data so it can be used effectively by AI systems. AI applications are expanding fast, especially in areas like automation, customer engagement, and operational intelligence—creating opportunities for platforms that seek to help businesses navigate AI integration.
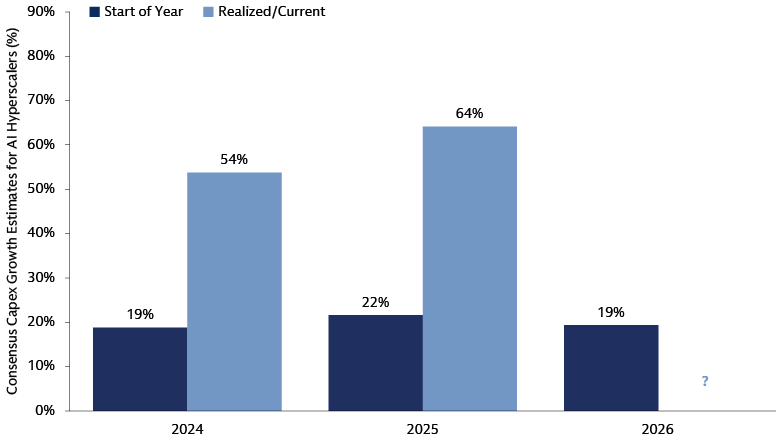
Sources: FactSet, Goldman Sachs Global Investment Research. As of October 17, 2025. Hyperscalers include: Amazon, Google, Meta, Microsoft, and Oracle.
1 Bloomberg. As of November 11, 2025.
2 S&P Global. As of October 30, 2025.
3 Bloomberg, Reuters. First Brands, Tricolor collapses raise fears of credit stress. As of October 14, 2025.
4 Goldman Sachs Global Investment Research. As of October 14, 2025.
5 Goldman Sachs Global Investment Research. As of October 3, 2025.
6 Goldman Sachs Global Investment Research. As of October 3, 2025
7 Goldman Sachs Global Investment Research. As of June 30, 2025.
8 Bloomberg. As of November 5, 2025.